

Key Highlights
- As of March 26, XRP’s Sharpe Ratio moved into positive territory, indicating that current returns outpace associated risk levels
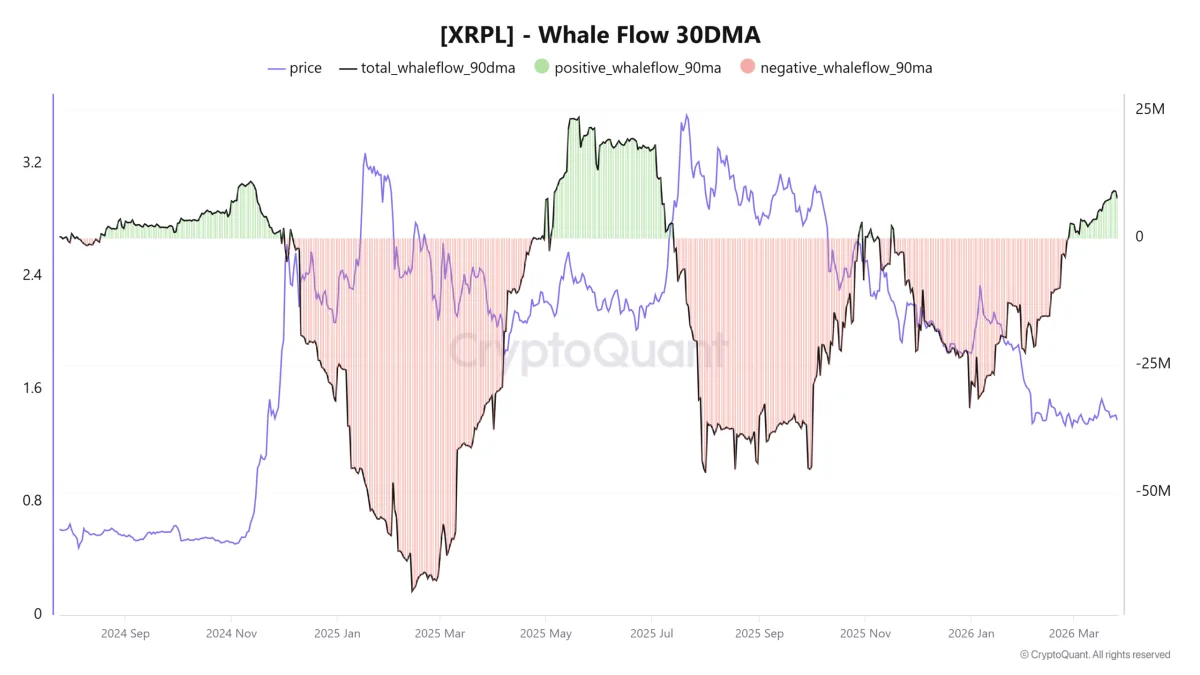
- Daily whale inflows have maintained a $9 million average over the past 30 days, marking the most sustained accumulation period since the April–July 2025 timeframe
- March 26 saw open interest climb 14.8% within 24 hours, though consistent long position liquidations reveal futures market instability
- A breakdown from an ascending triangle formation has resulted in a 13.63% decline across 10 days, bringing support zones at $1.27 and $1.11 into view
- Future price estimates from various analysts and algorithmic models span from $5.35 by 2030 to potential highs between $17 and $27 on extended timelines
Ripple’s XRP currently trades within the $1.33–$1.40 range, occupying lower price territory following a challenging period of market activity. The digital asset has shed 13.63% across the last 10 days after failing to maintain support within an ascending triangle formation.
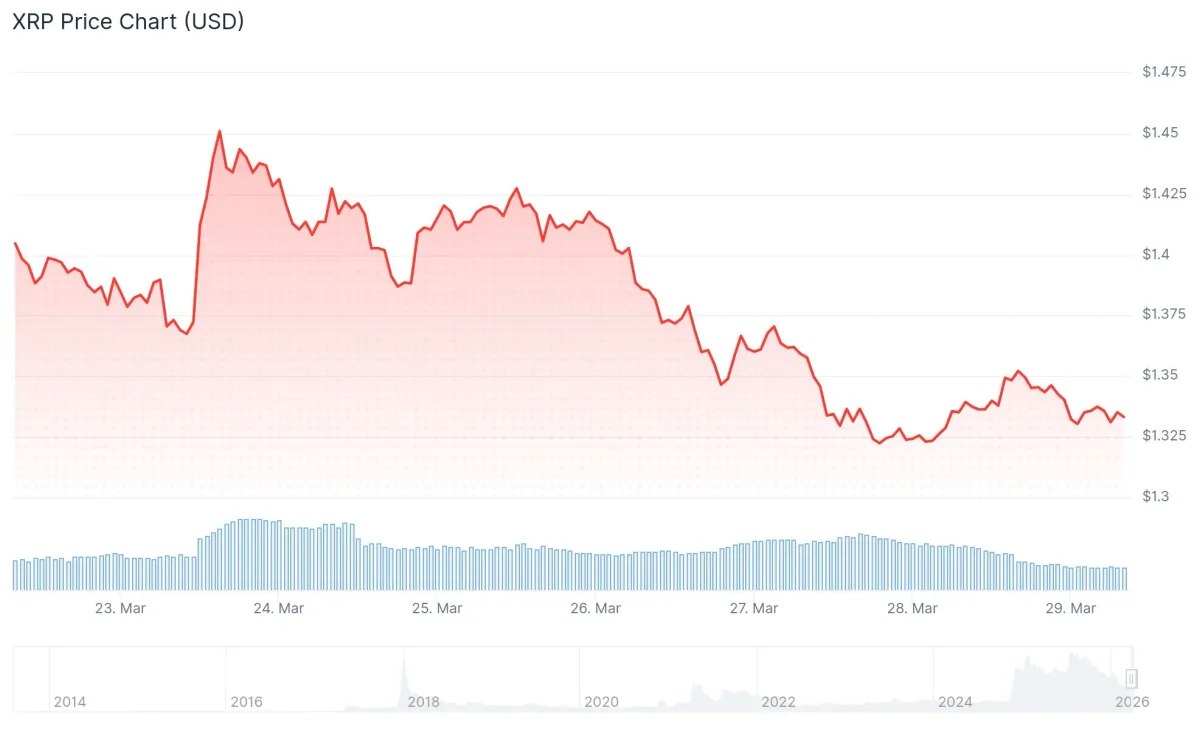
Despite the recent downward momentum, certain blockchain metrics reveal encouraging developments occurring below the surface.
XRP’s Sharpe Ratio crossed into positive territory on March 26. The 30-day average return stands at 0.00063, accompanied by a Sharpe Ratio of 0.0267. According to crypto analyst Arab Chain, this reading indicates “current returns still exceed risk” and demonstrates a “gradual positive rebalancing” for the digital asset. The analyst noted that a reversal back to negative readings could indicate renewed volatility conditions.
Large holder activity has demonstrated notable strength. The 30-day moving average for whale inflows into XRP wallets has reached $9 million daily. This accumulation trend has persisted since February 27, representing the longest continuous period since the April through July 2025 window. That previous accumulation phase concluded with XRP reaching its all-time peak of $3.65 on July 18, 2025.
Derivatives Market Displays Instability
Analyst Amr Taha highlighted that the 24-hour change in open interest reached 14.8% on March 26, marking the strongest reading since March 4. This metric reflects increased trader engagement. However, the data simultaneously reveals a recurring pattern of aggressive long positions being forcibly closed.
Liquidation episodes exceeding $2.5 million occurred on March 18, with subsequent events totaling $2.45 million on March 21 and $2.15 million on March 26. These consecutive liquidation waves suggest a vulnerable futures environment, where traders face repeated position resets amid short-term price swings.
Should present market dynamics persist, analysts anticipate possible tests of support zones around $1.27 and the yearly bottom at $1.11.
Extended Timeline Projections Show Wide Range
Analyst Egrag Crypto has identified a macro-level ascending triangle formation for XRP, with Fibonacci-based targets positioned at $8, $17, and $27, characterizing the current decline as a “retest phase” that qualifies as “normal and necessary.” Fellow analyst Dark Defender projects XRP could potentially reach the $5 zone.
#XRP – Macro Ascending Triangle 📐($8 → $17 → $27):
💡This is not random price action….. this is structure playing out over years.
🟡Macro View:
▫️ #XRP is holding a multi-year ascending trend (MYATL)
▫️ Formed a macro ascending triangle
▫️ Brokeout already happened → now… pic.twitter.com/LqmVgYmoGF— EGRAG CRYPTO (@egragcrypto) March 22, 2026
CoinCodex algorithmic forecasts place XRP at $1.64 by the close of 2026, advancing to $5.35 by 2030, $8.06 by 2040, and $13.42 by 2050.
The potential approval of cryptocurrency regulatory clarity legislation stands as another factor under consideration, particularly given XRP’s documented sensitivity to shifts in regulatory frameworks.
As of late March 2026, XRP whale inflows have sustained positive momentum for more than 30 consecutive days, with the moving average holding steady at $9 million in daily capital flows.



