

Quick Overview
- XRP currently trades at $1.39, experiencing a 3.46% decline over the past day
- The digital asset maintains stability at the $1.40 support threshold following recent bearish movement
- Upward movement through the $1.45–$1.50 resistance zone could indicate renewed bullish momentum
- The Relative Strength Index registers 46, positioned beneath the 50 neutral threshold, indicating subdued momentum
- Movement beneath $1.3850 may trigger further downside toward $1.3620 or deeper levels
XRP maintains its position near a significant support threshold following a wave of selling activity. The cryptocurrency has retreated from higher price points and currently consolidates around the $1.40 mark.
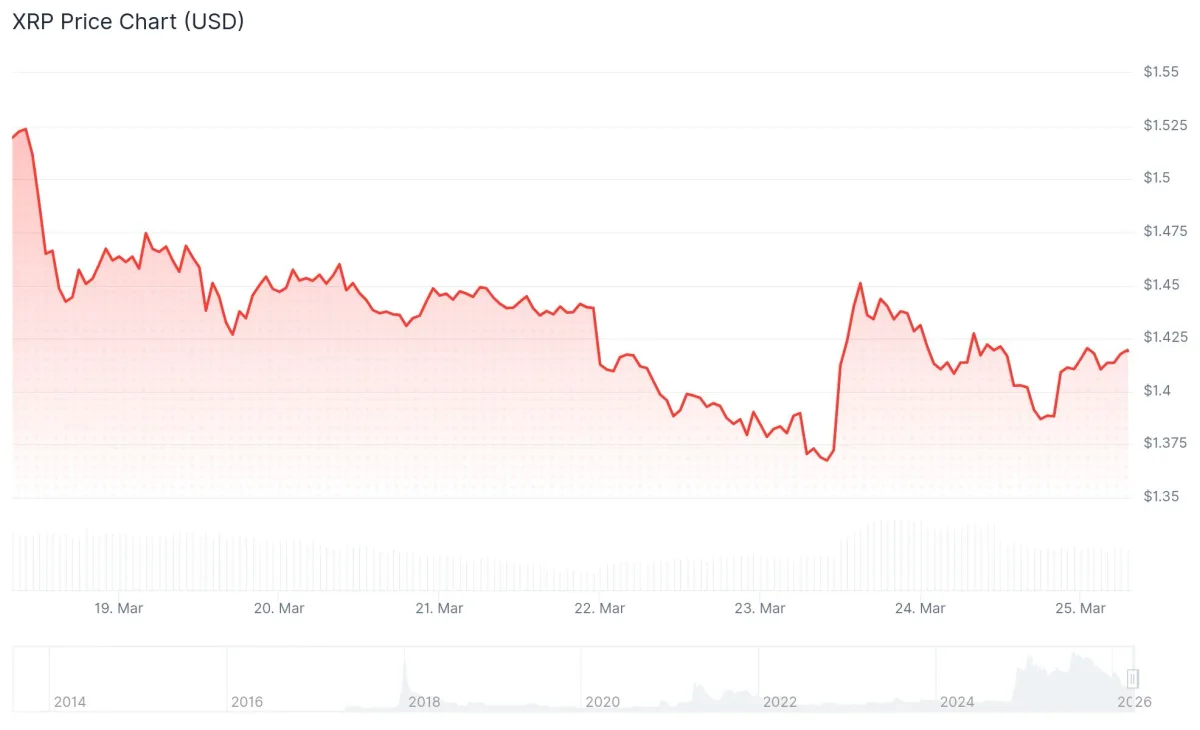
Current trading data shows XRP at $1.39. Daily trading volume reaches $3.16 billion while market capitalization stands at $85.87 billion, based on CoinMarketCap data. The cryptocurrency has experienced a 3.46% decrease during the previous 24-hour period.
XRP advanced beyond the $1.41 and $1.42 levels before reaching a peak at $1.4650. Following this high, sellers emerged and drove the price back under $1.45 and $1.44.
The cryptocurrency fell through the 61.8% Fibonacci retracement measured from the $1.3612 low to the $1.4650 high. Demand appeared around $1.3850, near the 76.4% Fibonacci level, preventing additional downward movement.
Crypto analyst BitGuru highlighted on March 24 that XRP trades within what he identifies as a significant accumulation zone. He observed that price behavior follows a breakdown from a falling wedge formation and that XRP appears to establish support at $1.40.
$XRP is moving inside a key accumulation zone after a long downtrend and recent falling wedge breakdown.
Price is now stabilizing around 1.40 support, showing signs of base formation. If buyers manage to push and hold above 1.45–1.50 resistance. pic.twitter.com/AFIZozlx3b
— BitGuru 🔶 (@bitgu_ru) March 24, 2026
Technical Indicators Show Cautious Outlook
The Relative Strength Index currently reads approximately 46, remaining beneath the 50 neutral mark. This positioning indicates that selling pressure continues to dominate market dynamics.
XRP trades beneath its 20-day moving average of $1.41 and significantly below the 200-day moving average positioned at $2.09. The moving average ribbon displays a bearish configuration.
The MACD indicator lines remain flat within negative territory. A bullish crossover has yet to materialize, indicating momentum remains unfavorable for buyers.
Critical Price Levels Under Focus
For upward movement, initial resistance appears near $1.4250. Clearing this barrier would expose $1.44, followed by $1.4650.
Sustained movement above $1.4650 could establish targets at $1.50, then $1.5250. Bulls require price action above $1.4250 to maintain any upward trajectory.
Should XRP struggle to advance higher, initial support emerges at $1.40. Additional support levels include $1.3850, followed by $1.3620.
A closing price beneath $1.3620 may drive the cryptocurrency toward $1.35 or potentially $1.3320.
This trendline could offer a strong buying opportunity for $XRP! pic.twitter.com/rdyxCeal1s
— Ali Charts (@alicharts) March 20, 2026
Analyst Ali Charts shared on X that a significant trendline may provide a compelling opportunity for XRP accumulation, highlighting the present support zone as a favorable entry region.
XRP currently maintains position above $1.40 and the 100-hourly Simple Moving Average, with market action reflecting a cautious stance among market participants.



