

TLDR
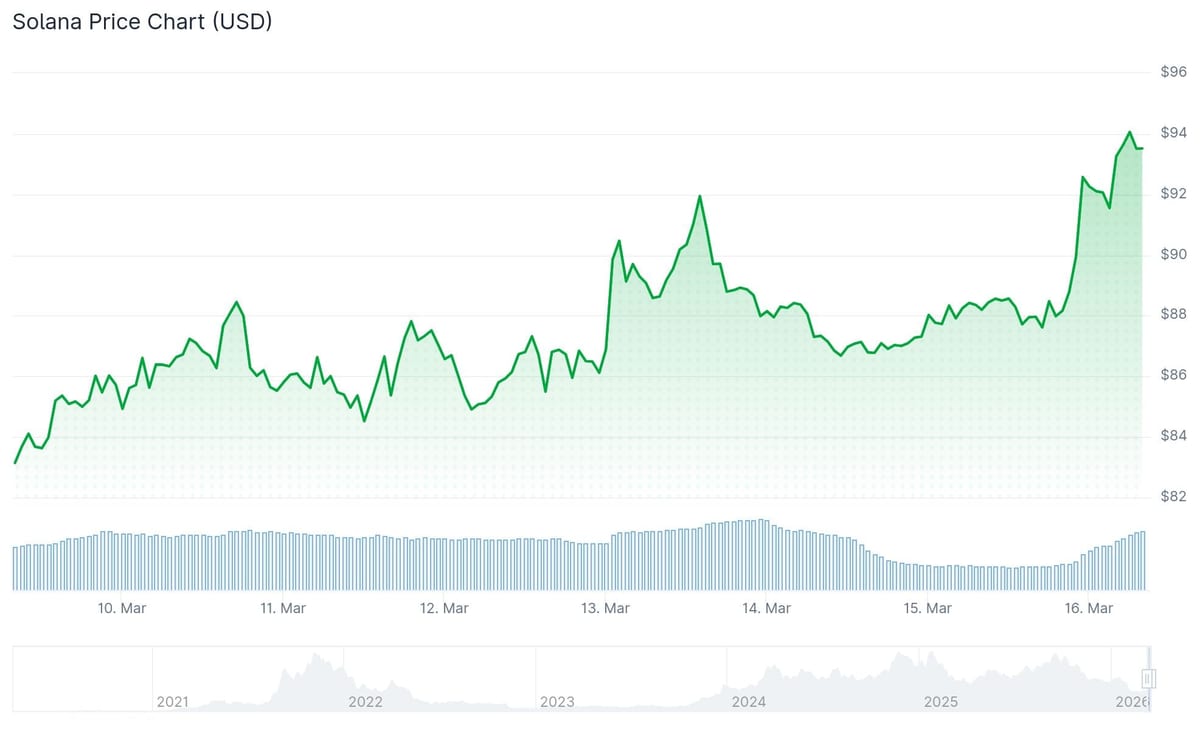
- SOL has reached $92–$93, climbing approximately 4–5% in a single day following a 13% gain across the previous week.
- Institutional demand remains strong, with SOL ETFs recording $10.70 million in net weekly inflows.
- Futures Open Interest expanded more than 7% in 24 hours, reaching $5.57 billion while bearish traders faced $14.43 million in liquidations.
- The 50-day EMA at $94.17 represents the immediate technical hurdle, while the 100-day EMA at $109.58 marks the next upside target.
- Bitwise data shows tokenized real-world assets on Solana have grown to approximately $873 million.
Solana has staged a meaningful rebound following a steep correction from its January 2026 high near $295. The token has posted a 13% gain over the past seven days and currently trades within the $92–$93 zone.
ETF products focused on SOL attracted $7.60 million on Friday alone, bringing the weekly inflow total to $10.70 million. This sustained capital movement indicates persistent institutional accumulation throughout the recent price correction.
Derivatives markets reflect increasing bullish sentiment. Futures Open Interest expanded by more than 7% within 24 hours, reaching $5.57 billion. Bearish traders faced significant pressure, accounting for $14.43 million of the $15.50 million in total liquidations during this period.
$SOL/monthly
Textbook Cup and Handle pattern on #Solana 📈
Nothing complicated here — just follow basic TA. The pattern is clear, the setup is bullish.
The only question is whether you have the faith to act on it 💭 pic.twitter.com/vnNEAp1bzy
— Trader Tardigrade (@TATrader_Alan) March 13, 2026
The token trades just beneath the 50-day Exponential Moving Average of $94.17. A confirmed daily close above this threshold would establish a technical pathway toward the 100-day EMA positioned at $109.58.
Momentum signals are strengthening. The MACD indicator has crossed into positive territory while the RSI reads 58, settling above the neutral 50 level.
Real-World Asset Growth Supports Solana’s Case
Tokenized real-world assets represent a significant narrative supporting SOL’s recent performance. Bitwise research indicates that RWAs on Solana have expanded to roughly $873 million, spanning on-chain treasuries, private credit instruments, and various yield-generating products.
Spot Solana ETFs, which received regulatory approval in late 2025, have maintained consistent capital attraction despite periods of downward price movement. Traditional finance participants now utilize these investment vehicles to gain SOL exposure while avoiding direct custody requirements.
From March 9 to March 13 (ET), Bitcoin spot ETFs recorded net inflows of $767 million, marking three consecutive weeks of net inflows. Ethereum spot ETFs saw $161 million in net inflows, also extending their three-week inflow streak. SOL spot ETFs posted $10.7 million in net… pic.twitter.com/slBc1GuHw6
— Wu Blockchain (@WuBlockchain) March 16, 2026
On-chain metrics support this growth trajectory. Active addresses have surpassed 5 million while daily transactions are nearing 87 million.
Network and Supply Context
The Solana validator network has expanded to more than 2,000 validators according to some metrics, though the active validator count may be closer to 795. The Solana Foundation’s proportion of staked SOL has declined substantially, falling from over 40% in 2020 to under 6% by late 2025.
Annual network inflation operates at approximately 4%. Staking participation has reached about 67% of total supply, effectively constraining the amount of freely circulating tokens.
Perpetual swap funding rates remain near neutral to slightly negative at roughly −0.0095% per day. This metric suggests leveraged long positions have yet to accumulate aggressively.
Downside support zones exist within the $76–$80 range. Major resistance remains concentrated near $245–$250, corresponding to the January peak region.
Current trading places SOL at approximately $92–$93, with the 50-day EMA at $94.17 serving as the next immediate technical barrier.



