

Key Highlights
- SOL maintains trading activity around $87–$88, positioned above the 50-day EMA, facing hurdles at $90–$94
- Crypto analyst Ali Martinez identified compressed Bollinger Bands creating a $77-$94 range on the 3-day timeframe
- SOL-based ETFs attracted $9.44 million in weekly net capital, extending a five-day streak that accumulated approximately $1.45 billion
- Goldman Sachs revealed holdings of roughly $108 million in SOL
- Breaking decisively above $94 may enable progression toward $100; falling beneath $77 could trigger further decline
Solana (SOL) continues its Monday session near the $87–$88 range, maintaining a position above the 50-day Exponential Moving Average (EMA) currently at $87.04. The digital asset has bounced from its recent trough around $84.55 and now confronts a significant resistance area.
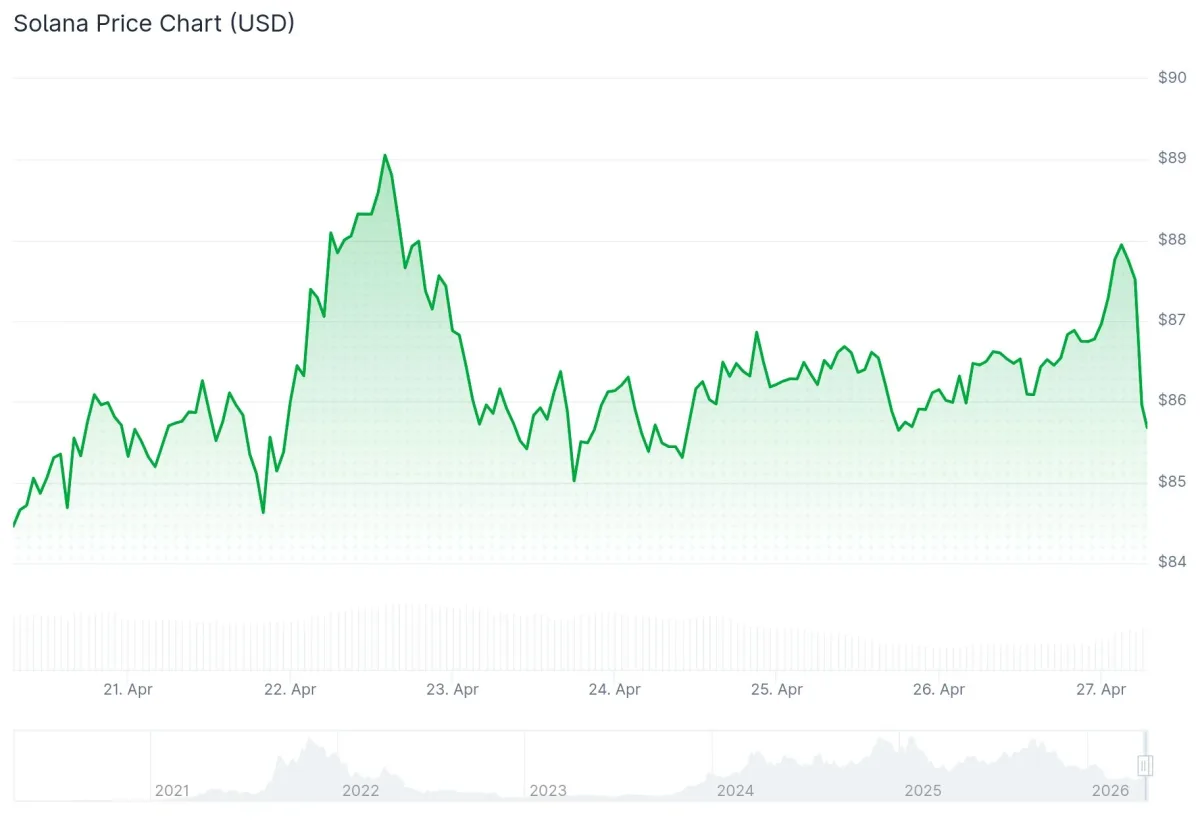
SOL crossed above the 50% Fibonacci retracement mark derived from the latest decline spanning $89.34 down to $84.55. An upward-sloping trendline has emerged, providing support near $86.50 on the hourly timeframe.
The first resistance barrier appears at $88.20, corresponding to the 76.4% Fibonacci extension. Beyond that, the primary resistance zones sit at $90, with $92 following as the subsequent level.
Crypto analyst Ali Martinez noted that SOL remains confined within a narrow Bollinger Band corridor on the 3-day chart, spanning from $77 to $94. He characterized this area as unsuitable for active trading, cautioning that attempting to capitalize on movements inside this range could result in erratic losses. Martinez emphasized that a definitive 3-day candlestick closure beyond these bands would be necessary to validate any genuine directional shift.
Solana $SOL is ready for a big price move!
The Bollinger Bands are squeezing on the 3-day chart, creating a tight price range between $77 and $94. This high-timeframe squeeze could act like a coiled spring. The longer the price stays in here, the more energy it builds for the… pic.twitter.com/AtV8GaUwiu
— Ali Charts (@alicharts) April 24, 2026
Trading volume has declined by more than 23% throughout this consolidation period. Reduced volume during lateral price movement is typical, yet any advance beyond $94 would require enhanced market participation to validate a push toward $100.
Technical Metrics Show Modest Bullish Tilt
The Relative Strength Index (RSI) registers at 55, climbing above the neutral threshold on the daily timeframe. The MACD alongside its signal line have transitioned into bullish territory, indicating that purchasing pressure currently holds advantage.
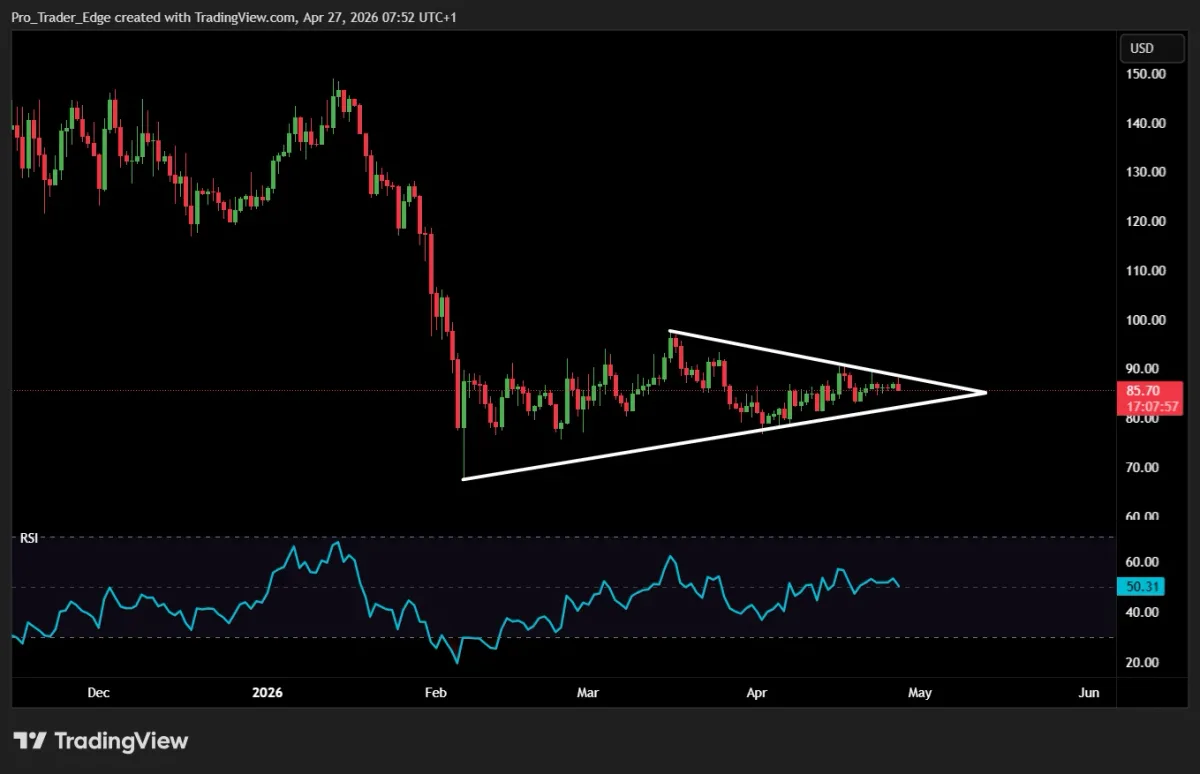
SOL approaches the upper boundary of a symmetrical triangle formation around $89.00 on the daily chart. A convincing breach above this threshold would bring the $100 psychological milestone into focus, followed by the 200-day EMA positioned at $113.
Regarding downside scenarios, the 50-day EMA at $87.04 serves as the initial support barrier. A daily closing price beneath the ascending trendline near $85.99 would compromise the existing bullish framework.
Exchange-Traded Fund Activity and Institutional Positioning
SOL-focused exchange-traded funds captured $9.44 million in net weekly capital flows, following the previous week’s $35.17 million intake. An unbroken five-day sequence of positive net flows has accumulated roughly $1.45 billion.
Goldman Sachs unveiled holdings approaching $108 million in Solana, contributing another institutional data point under market observation.
SOL futures Open Interest expanded beyond 2% within a 24-hour period to reach $5.23 billion. The funding rate jumped to 0.0095%, reflecting that traders are accepting higher costs to maintain leveraged long exposure.
Should SOL struggle to penetrate the $90–$94 zone, preliminary downside support levels emerge at $86.50, followed by $85. A daily close dropping below $78 may direct price action toward $72.



