

Key Highlights
- Cryptocurrency investment vehicles attracted $230M last week, with Bitcoin leading at $219M
- SOL maintained its streak with $17M in the seventh consecutive week, reaching $136M cumulative total
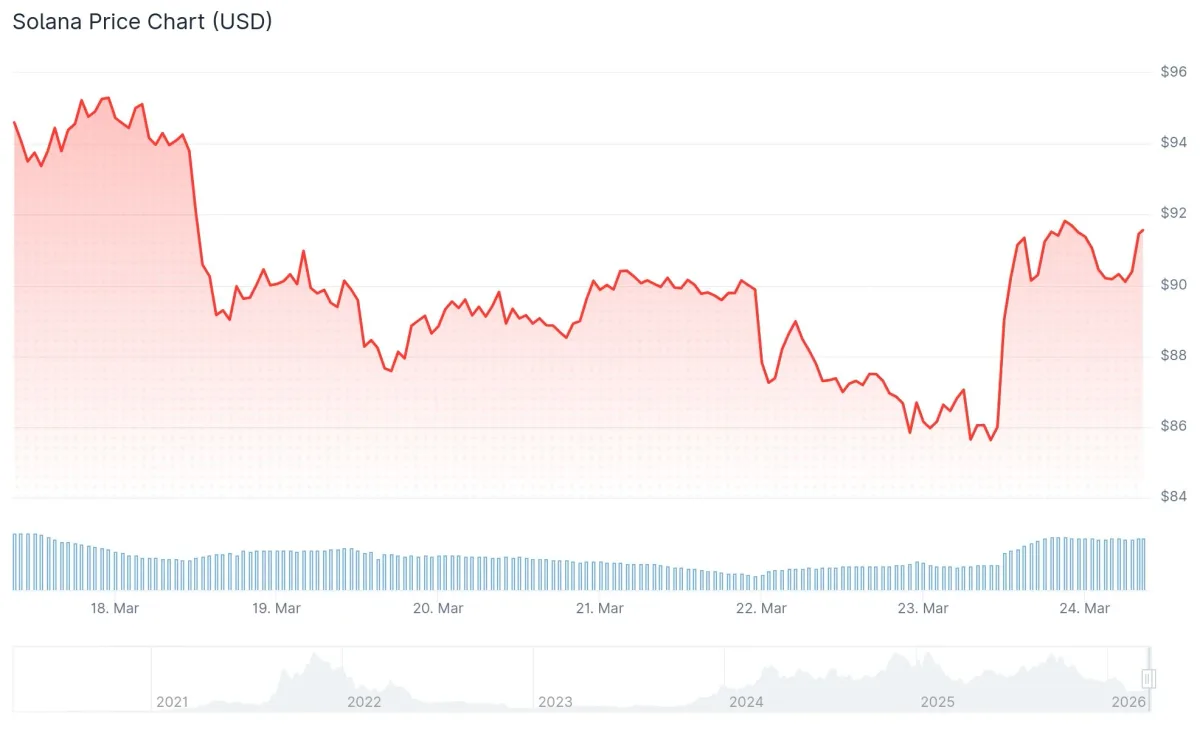
- Current SOL pricing hovers near $91–92, showing 5.64% daily gain while posting 3% weekly decline
- Technical analysis reveals rising wedge formation on 3-day timeframe suggesting continuation downward
- Critical price zones include $78 floor and $95 ceiling, with $65–70 representing possible decline target
Solana (SOL) currently trades within the low $90s territory following a brief uptick, though technical formations suggest sustainability concerns for this upward movement.
Cryptocurrency investment vehicles recorded $230M in aggregate capital additions last week, based on CoinShares reporting. The week began strongly with $635M in positive flows, though sentiment reversed following the Federal Reserve’s policy meeting, resulting in $405M departing mid-week.
[[EMBED_0]]
The United States dominated geographic inflows at $153M. German investors contributed $30.2M while Switzerland accounted for $27.5M.
Bitcoin captured the majority of incoming capital at $219M. Ethereum experienced $27.5M in withdrawals, ending its three-week positive run.
Solana secured $17M during the previous week, marking its seventh straight week of positive flows. The cumulative total across this period reached $136M.
SOL traded at $91.61 during reporting, reflecting a 5.64% increase over 24 hours. The daily advance contrasts with approximately 3% erosion across the trailing seven-day period.
Rising Wedge Formation Signals Potential Weakness
Technical analyst CryptoBullet identified a rising wedge structure developing on Solana’s 3-day chart. This formation emerged following SOL’s breach below its 200-week moving average, a metric frequently employed for long-term trend assessment.
[[EMBED_1]]
Successive rallies within the wedge boundaries demonstrate diminishing strength. This behavior indicates buyer exhaustion and waning upward momentum. Rising wedge patterns that develop after substantial declines typically foreshadow downtrend continuation.
Should SOL violate the wedge lower boundary, accelerated selling could materialize. Analyst DrBullZeus identifies $78 as crucial support, with breakdown scenarios potentially reaching $65–70.
Weekly Timeframe Presents Conflicting Indicators
The weekly chart displays 100 and 200 EMAs maintaining upward trajectories, indicating positive longer-term structure. Conversely, the 20 and 50 EMAs have leveled off, reflecting momentum deceleration.
Bollinger Bands demonstrate tight compression, a configuration that generally precedes significant directional movement. The RSI registers in the mid-30s range — avoiding oversold conditions while confirming seller dominance.
The MACD line persists in bearish territory, though histogram bars are contracting, suggesting potential moderation in selling intensity.
Chainlink and Hyperliquid attracted smaller inflows of $4.6M and $4.5M respectively during the previous week.
Regarding upside scenarios, a breach above $95 could propel SOL toward $110–$120. Extended projections from analyst Moonbag target $260–$300 contingent upon SOL reclaiming the $180–$200 range.
The Balance of Power indicator currently registers negative values, with sellers maintaining control according to recent data.



