

Key Highlights
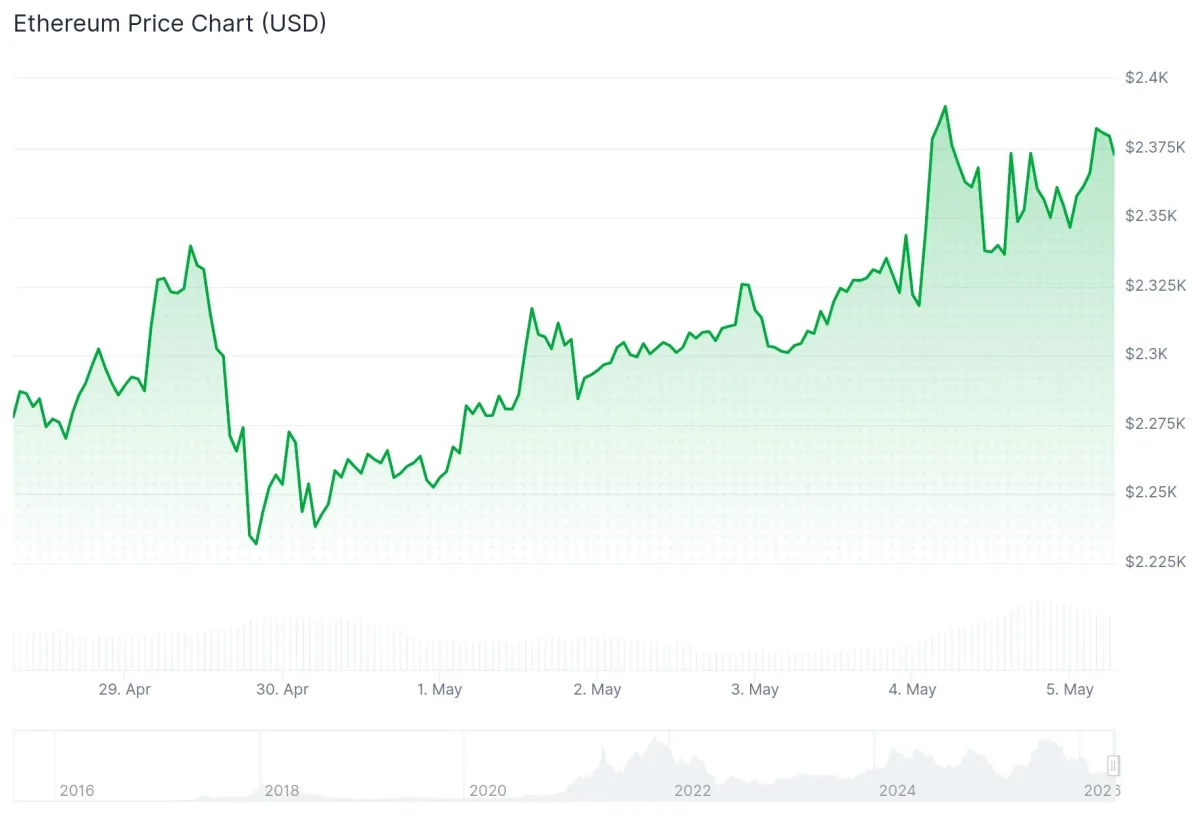
- ETH reached $2,390, climbing above its realized price of $2,320, returning the average holder to profitable territory
- Daily chart reveals a bull flag formation with a measured target of $3,018
- Crypto analyst Dami-Defi anticipates a break above $2,400 will spark a “violent move” reaching $2,800–$3,000
- A concentration of 7.1 million ETH exists between $2,750–$2,850, forming a potential resistance barrier
- The RSI indicator has risen to 56 from previously near-oversold territory at 36 in late March
Ethereum has successfully reclaimed its realized price level of $2,320, bringing the average ETH holder back into positive territory. The cryptocurrency reached a peak of $2,398 before experiencing a minor pullback to settle near $2,376, reflecting a 2.2% increase over the past 24 hours alongside a trading volume of $24.23 billion.
The realized price represents the average acquisition cost for all ETH that has been transacted on-chain. Historical patterns show that trading above this metric typically catalyzes a sentiment shift from fear to greed.
When ETH previously recaptured this threshold in May 2025, the asset subsequently rallied 173% to reach its all-time peak of $4,950. Similarly, in early 2023, a comparable reclaim preceded a 58% advance.
Crypto analyst Dami-Defi shared on X that penetrating the $2,400–$2,600 corridor would unleash the “most violent move of the year” toward $3,000, declaring: “Once we break $2,400 we will catapult violently to $2,800–$3,000.” The analysis highlighted an evident zone of momentum accumulation on the weekly timeframe.
$ETH is one candle away from triggering the most violent move of the year.
we has been sideways since Feb
once we break $2400 we will catapult violently to $2800 – $3000 pic.twitter.com/wNb2oXxNgd
— Dami-Defi (@DamiDefi) May 3, 2026
Bull Flag Formation Indicates $3,018 Objective
Examining the daily timeframe, Ethereum has developed a bull flag configuration. The asset is presently retesting the $2,350 resistance level, where the flag’s upper boundary converges with the 100-day EMA.
A confirmed daily close above this threshold would establish a measured objective of $3,018. Market analyst Cohelson David separately identified a broadening wedge pattern on the 12-hour chart also pointing toward the $3,000 mark.
The RSI has rebounded to 56 from previously near-oversold readings of 36 recorded in late March, indicating renewed buyer participation.
Critical Resistance Zone at $2,800
Despite the constructive technical setup, a significant barrier exists between $2,750 and $2,850. Approximately 7.1 million ETH was purchased at average costs within that corridor, establishing a zone where numerous holders may seek to exit at breakeven.
Cryptocurrency analyst Crypto Patel identified $2,400, $2,700, and $3,000 as the critical upside thresholds to monitor. He observed that inability to breach $2,400 could result in price retreating toward $2,000 support.
$ETH PUMPING! Next Stop $2,700 → $3,000 Decides EVERYTHING 🔥
ETHEREUM pumping hard, now back near $2,400
➡️ Next target: $2,700 → Daily FVG
➡️ Above that: $3,000 → Bearish Order Block (decides the next major move)✅ Break above $3K → Road to New ATH $10K 🚀
❌ Rejection… pic.twitter.com/aBUPyPizMd— Crypto Patel (@CryptoPatel) May 4, 2026
The MACD line at 25.03 remains positioned below the signal line of 32.00, accompanied by a histogram reading of -6.97, indicating momentum is experiencing minor deterioration in the near term.
Immediate support resides at $2,323, with additional foundational levels at $2,219 and $2,179. ETH’s market capitalization currently stands at $282.39 billion.
ETH is presently trading above $2,360 and the 100-hour simple moving average, with a bullish trend line maintaining support at $2,350 on the hourly timeframe.



