

Key Takeaways
- ETH declined through $2,220 support and reached $2,025, currently ranging between $2,020–$2,100
- Dual bearish trend lines present obstacles at $2,120 and $2,165 resistance zones
- Pushing above $2,165 may drive ETH toward $2,200–$2,300 range; losing $2,025 could trigger decline to $2,000 or beneath
- Spot Ethereum ETFs recorded $59.94 million in net outflows during the previous week, with BlackRock’s ETHA accounting for $69.59 million
- Combined Ethereum spot ETF net assets total $12.33 billion, representing a 4.79% ETF net asset ratio
Ethereum experienced a substantial pullback during the recent trading session, declining from approximately $2,385 down to $2,025. The digital asset currently changes hands beneath $2,100 and the 100-hourly Simple Moving Average.
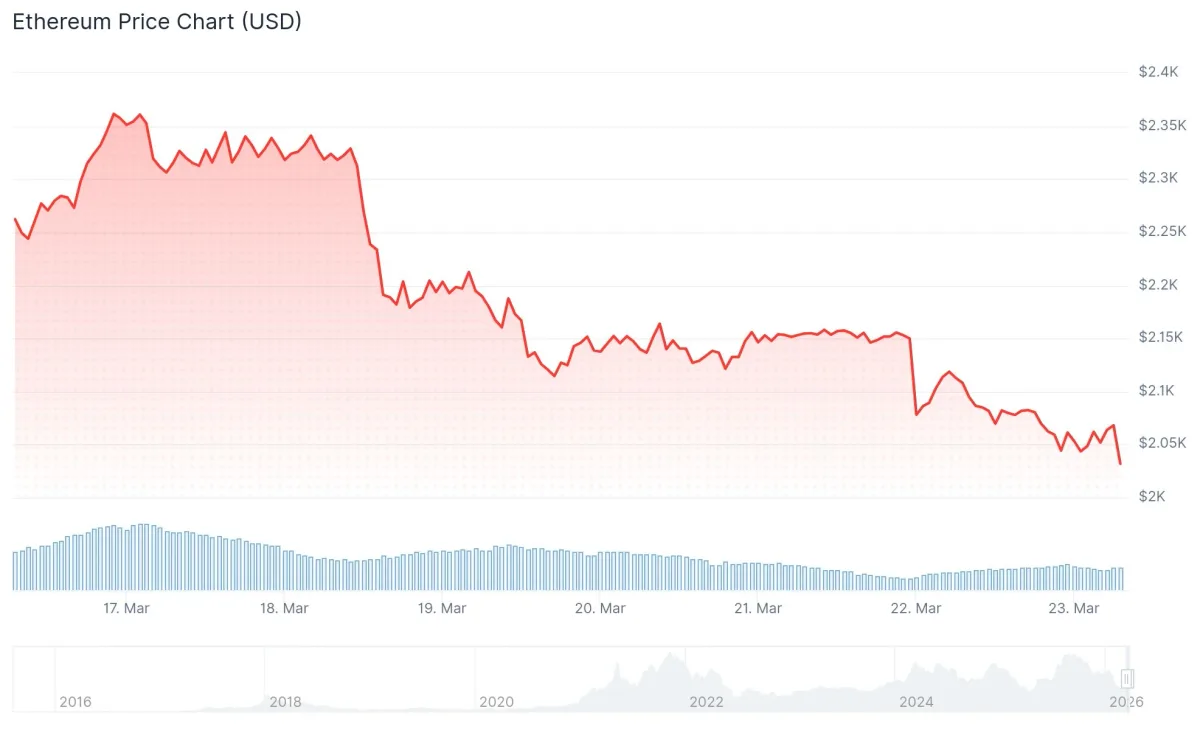
The selloff commenced following ETH’s inability to sustain momentum above $2,220. The cryptocurrency breached $2,150 and $2,120 levels before momentarily dipping beneath $2,050.
ETH currently consolidates losses underneath the 23.6% Fibonacci retracement level measured from the $2,385 high to $2,025 low. Two descending trend lines appear on the hourly chart, establishing resistance barriers at $2,120 and $2,165.
The initial critical resistance zone stands at $2,120, coinciding with the 100-hourly Simple Moving Average. Breaking above this threshold would bring $2,165 into focus as the subsequent obstacle.
Should ETH overcome $2,165, the 50% Fibonacci retracement level emerges around $2,200. Clearing this area could pave the path toward $2,250 or potentially $2,300.
Critical Support Zones Under Focus
Regarding downside risk, the first support level appears around $2,040. Beneath this point, the $2,025 area represents the primary foundational level.
A decisive move below $2,025 would direct attention toward the $2,000 psychological level. Additional weakness might expose $1,965, with $1,880 serving as extended support.
$ETH seems to be forming head and shoulder pattern.
If Ethereum loses the $2,040 level, expect a massive dump. pic.twitter.com/EZGbDEYvq2
— Ted (@TedPillows) March 22, 2026
Crypto market analyst Ted Pillows shared observations on X regarding ETH’s chart structure. His analysis stated: “$ETH seems to be forming head and shoulder pattern. If Ethereum loses the $2,040 level, expect a massive dump.”
Institutional Outflows Compound Bearish Sentiment
Ethereum spot ETFs registered net outflows totaling $59.94 million during the March 16–20 trading week, based on SoSoValue data cited by PANews on March 23.
From March 16 to March 20 (ET), Bitcoin spot ETFs recorded net inflows of $95.18 million, marking four consecutive weeks of net inflows. Ethereum spot ETFs saw net outflows of $59.94 million. SOL spot ETFs recorded net inflows of $21.10 million, while XRP spot ETFs saw net… pic.twitter.com/oI6NJjhwZl
— Wu Blockchain (@WuBlockchain) March 23, 2026
BlackRock’s ETHA dominated outflows, experiencing $69.59 million in redemptions throughout the week. Despite this withdrawal, ETHA’s cumulative historical net inflow remains at $11.91 billion.
Fidelity’s FETH experienced $61.62 million in outflows during this timeframe. The fund’s aggregate historical net inflow stands at $2.32 billion.
The Grayscale Ethereum Mini Trust (ETH) emerged as the sole ETF capturing net inflows during the week, attracting $6.87 million. This fund’s historical cumulative net inflow has climbed to $1.85 billion.
As of March 23, aggregate Ethereum spot ETF net assets amount to $12.33 billion, accounting for 4.79% of Ethereum’s overall market capitalization. The combined historical cumulative net inflow across all Ethereum ETF products totals $11.73 billion.



