

TLDR
- Ethereum currently trades near $2,181, hovering within a critical support range of $2,150 to $2,200.
- Breaking beneath $2,150 could trigger a move toward the $2,000 psychological threshold.
- Technical indicators show RSI at 53.53, with price positioned above 20-day and 50-day averages while remaining under 100-day and 200-day benchmarks.
- Analyst Ali Charts identifies potential deeper support zones at $1,550 and $1,070 based on weekly timeframe analysis.
- Holding above present support opens the door for a climb toward $2,400, with $2,624 representing the subsequent upside target.
Ethereum has reached a critical juncture that market participants are monitoring with heightened attention. Current data shows ETH changing hands at $2,181.19, reflecting a 2.89% decline over the preceding 24-hour period. Daily trading volume registers at $28.19 billion, while the network maintains a market capitalization of $263.38 billion.
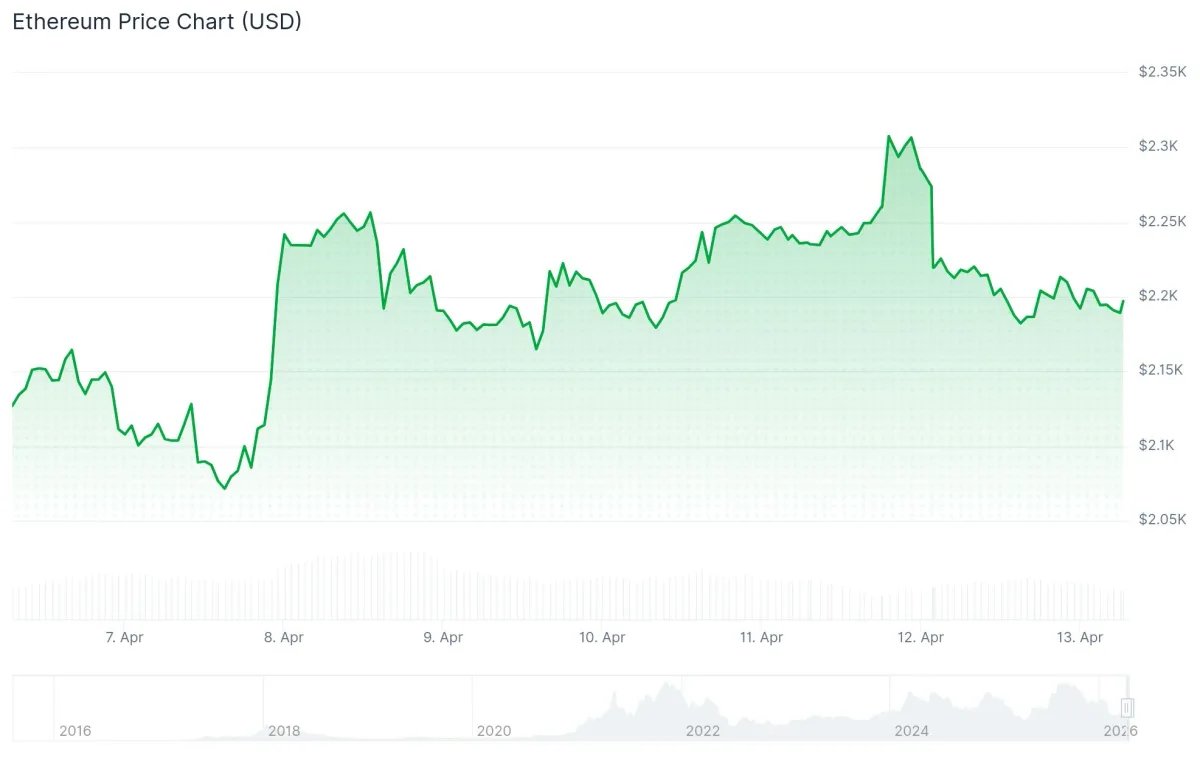
Market observers have zeroed in on the $2,150–$2,200 range as the determining factor for near-term direction. Technical analyst Ted highlighted on X that Ethereum approached the lower boundary of this range, with broader risk-averse sentiment weighing on global markets. He identified this area as the likely battleground where demand may resurface.
$ETH almost dropped to $2,200 today.
This happened after US-Iran talks failed, which means things could escalate again.
The key level for Ethereum here is $2,150-$2,200 and if that holds, ETH could push for another leg up higher.
Losing this zone means ETH will dump towards… pic.twitter.com/7eOBkpYcqJ
— Ted (@TedPillows) April 12, 2026
Maintaining position above $2,150 would set the stage for sideways trading and potentially enable advancement toward $2,400. This level represents the initial significant resistance point. Beyond that threshold, chart patterns suggest a secondary target in the vicinity of $2,624.
Should the $2,150 floor fail to hold, attention shifts to $2,000 — a psychologically significant level that has previously attracted buying interest.
Technical Metrics Present Neutral to Cautiously Optimistic Outlook
Current technical readings reveal the RSI positioned at 53.53, marginally exceeding its average of 53.40. This measurement suggests mild positive momentum without indicating decisive directional strength.
Ethereum maintains its position above both the 20-day SMA ($2,117.30) and 50-day SMA ($2,080.00), signaling that immediate-term support structures remain intact. The asset continues trading beneath the 100-day SMA at $2,360.14 and the 200-day SMA at $2,918.05, placing the longer-term trend in a relatively weaker configuration.
The MACD line hovers marginally above its signal counterpart, potentially suggesting the beginning of price stabilization. Analysts emphasize that sustained buying momentum will be necessary to confirm a meaningful reversal.
Extended Timeframe Analysis Identifies $1,550 and $1,070 Zones
Market analyst Ali Charts shared a weekly Ethereum price chart on X, illustrating that the asset could be trading within a parallel channel formation. The analysis pinpoints two significant downside levels worth monitoring: $1,550 and $1,070.
If the governing pattern behind Ethereum $ETH is actually a Parallel Channel, then I'll be watching $1,550 and $1,070 as the ultimate support levels. https://t.co/93y0hrX297 pic.twitter.com/snECHdaFy5
— Ali Charts (@alicharts) April 11, 2026
These figures correspond with historical reaction points visible on the weekly timeframe. The $1,550 mark would serve as the initial major support if the current base fails to hold. Further downside would bring $1,070 into focus as the more substantial support boundary.
Daily chart examination reveals that a breakdown from the $2,155 region would likely lead to a test of the $2,015 area. Continued weakness from there directs focus toward $1,775 as an additional support layer.
As of April 13, 2026, Ethereum trades at $2,181.19, with the $2,150 threshold serving as the decisive marker for immediate price trajectory.



