

TLDR
- Jeffrey Wilcke, Ethereum co-founder, deposited 79,176 ETH (approximately $157M) to Kraken exchange, triggering market concerns
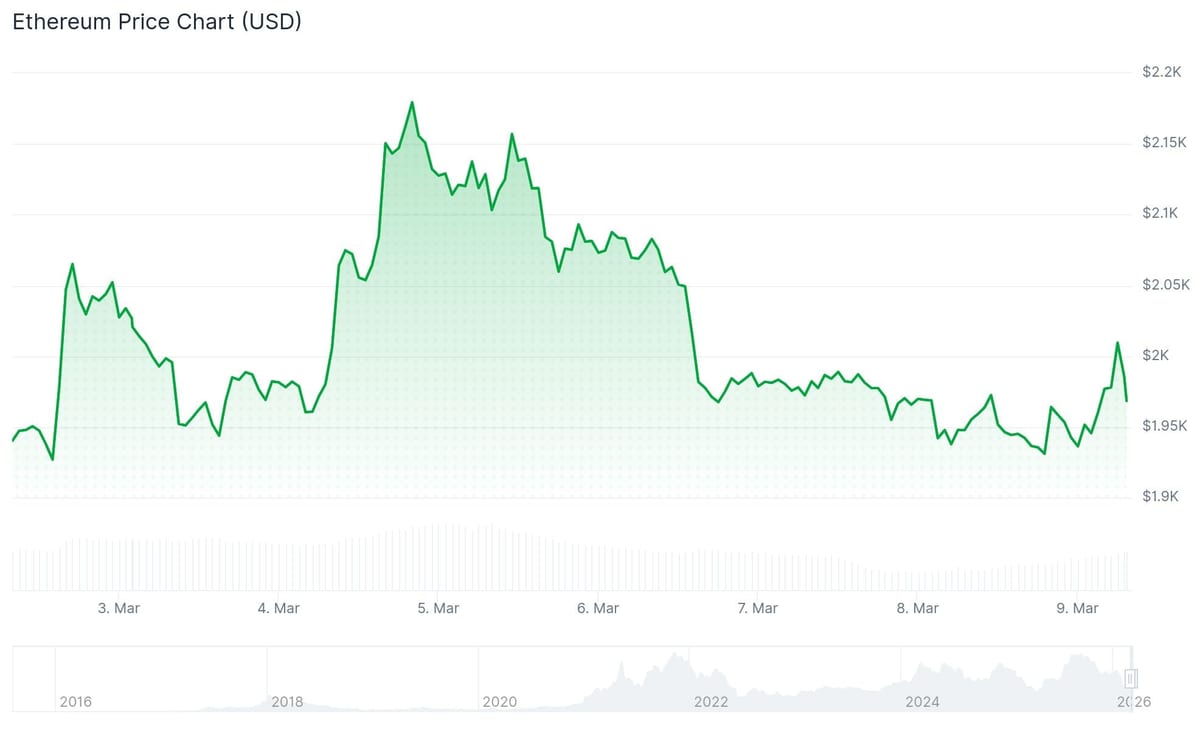
- ETH experienced a decline approaching 8% beginning March 6, reaching a bottom at $1,912
- Current trading occurs beneath the $2,000 threshold and the 100-hourly Simple Moving Average
- Large wallet holders (100K–10M ETH cohorts) continue building positions during the pullback
- Critical support zone identified between $1,900–$1,920; downside breach could lead to $1,800 testing
The second-largest cryptocurrency by market capitalization has faced sustained selling pressure beginning March 6, with prices declining approximately 8% and approaching a crucial support threshold near $1,900. Market anxiety intensified following Jeffrey Wilcke’s decision to move 79,176 ETH, valued at roughly $157 million, to the Kraken exchange platform.
Large-volume deposits to centralized exchanges typically signal potential selling activity in cryptocurrency markets. This transaction created uncertainty among market participants and contributed additional downward momentum to an already weakening price structure.
The digital asset reached a bottom at $1,912 before entering a consolidation phase. Current data from March 9 shows ETH trading beneath $1,980 and below the 100-hourly Simple Moving Average, maintaining bearish near-term pressure.
Large Holder Accumulation Provides Price Floor
Between March 2 and March 6, Bitcoin spot exchange-traded funds saw aggregate inflows totaling $568 million. Ethereum spot ETFs accumulated $23.56 million during the identical timeframe, demonstrating ongoing institutional demand even as ETH faced price challenges.
From March 2 to March 6 (ET),Bitcoin spot ETFs recorded net inflows of $568 million. Ethereum spot ETFs saw net inflows of $23.56 million. SOL spot ETFs had net inflows of $24.05 million. XRP spot ETFs experienced net outflows of $4.0855 million. https://t.co/YcNXWVZGwE pic.twitter.com/k3GvlU2hJu
— Wu Blockchain (@WuBlockchain) March 9, 2026
While Wilcke’s transaction generated market anxiety, data reveals certain large holder segments are building positions. Wallet cohort analysis indicates addresses containing between 100,000 and 10 million ETH have increased their holdings throughout this price decline.
This purchasing activity from substantial investors has established a support foundation preventing steeper losses. The market currently experiences conflicting forces between potential distribution from the co-founder’s exchange deposit and accumulation from other major stakeholders.
⚡️JUST IN: ETHEREUM CO-FOUNDER MOVES $157M IN ETH
LookOnChain flagged that Ethereum co-founder Jeffrey Wilcke deposited 79,176 $ETH ($157M) to Kraken in the past hour. pic.twitter.com/sacIBRDNYq
— Coin Bureau (@coinbureau) March 7, 2026
The $1,920 price point has maintained as immediate support during this period. Should buyers defend this level successfully, ETH could target recovery toward $1,980, followed by the psychological $2,000 barrier.
Upside resistance remains substantial and concentrated. The initial significant obstacle appears at $2,020, with $2,050 presenting the next challenge, corresponding to the 50% Fibonacci retracement level of the recent decline from $2,200 to $1,912.
Chart Indicators Show Bearish Configuration
Technical analysis reveals predominantly bearish signals across major timeframes. All significant moving averages remain positioned above current price action. The 200-period EMA sits at $2,899 while the 200-period SMA stands at $3,324, both considerably distant from current levels.
$ETH is now in no trading zone.
Either Ethereum needs to reclaim the $2,000 level or a retest of $1,850-$1,900 zone could happen before a reversal. pic.twitter.com/F3TcRC6nSX
— Ted (@TedPillows) March 8, 2026
Near-term momentum indicators present more balanced readings. The RSI registers 42.4, the Stochastic oscillator stands at 40.4, and the CCI shows −47.7. The ADX measures 29.9, indicating trend presence without extreme strength.
A breakdown below $1,920 would expose the subsequent support zone around $1,880. Further weakness could target the $1,800 region — a price area where historical buying interest has emerged.
As of March 9, 2026, ETH trades near $1,939, remaining beneath the $2,000 threshold that has proven resistant to recent recovery attempts.



