

TLDR
- ETH maintains a range between $2,040 and $2,100, recording a 6% decline across the previous week
- Binance realized volatility reached its lowest point since mid-January trading sessions
- Technical analyst Ted Pillows highlighted that a break below $2,000 may trigger intensified selling pressure
- Spot Ethereum ETFs recorded $4.9M in fresh capital on Monday, breaking an eight-day outflow streak of approximately $440M
- Diplomatic remarks from Iran’s President Pezeshkian regarding potential conflict resolution sparked a temporary 4% ETH rally
Ethereum has experienced notable selling pressure during the recent trading period, maintaining a range between $1,935 and $2,100 throughout the past seven days. The digital asset briefly slipped beneath the $2,000 threshold before stabilizing around the $2,040 to $2,100 zone by Tuesday’s trading session.
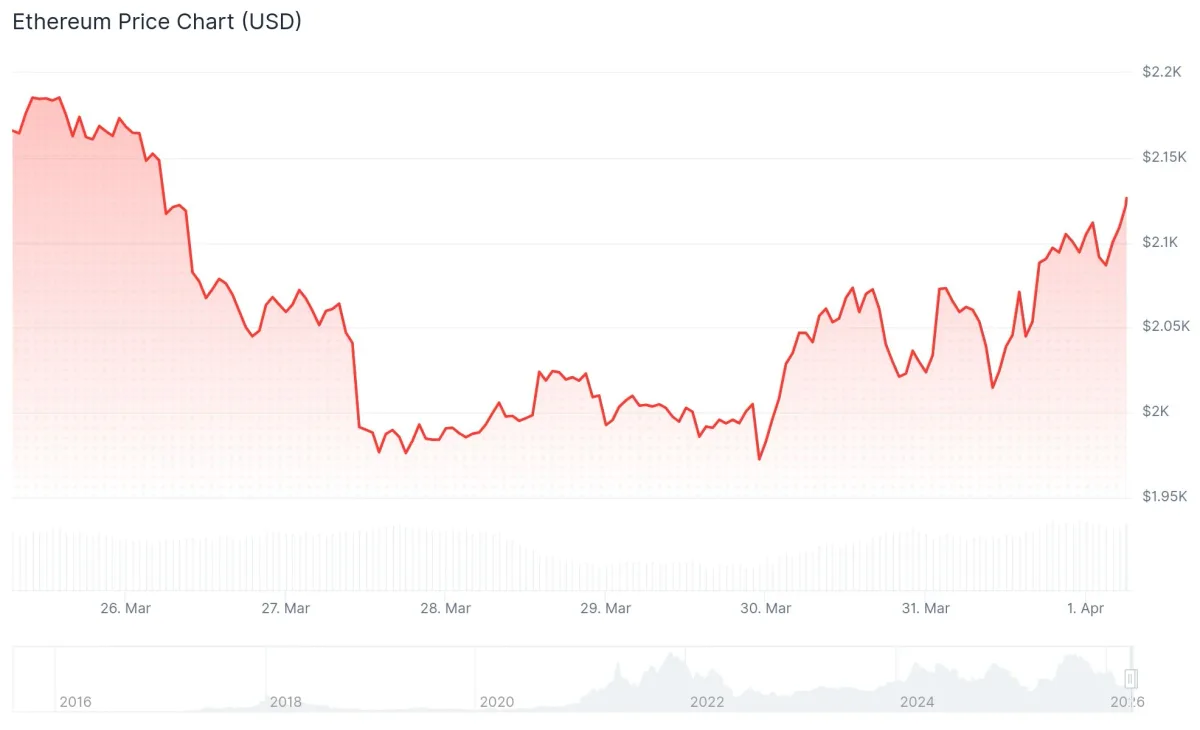
ETH has registered approximately 6% in losses across the week-long timeframe. The recent floor at $1,936 represented a critical inflection point where buying interest emerged to halt further decline.
The asset has subsequently regained ground above its 100-hourly Simple Moving Average. Price action also penetrated a near-term descending trend line that previously limited upward momentum around the $2,060 level.
Realized volatility metrics on Binance declined to 0.62 on Tuesday, contrasting with the 1.15 reading observed in mid-February. This figure represents the lowest measurement since early January, during which ETH commanded valuations exceeding $3,000.
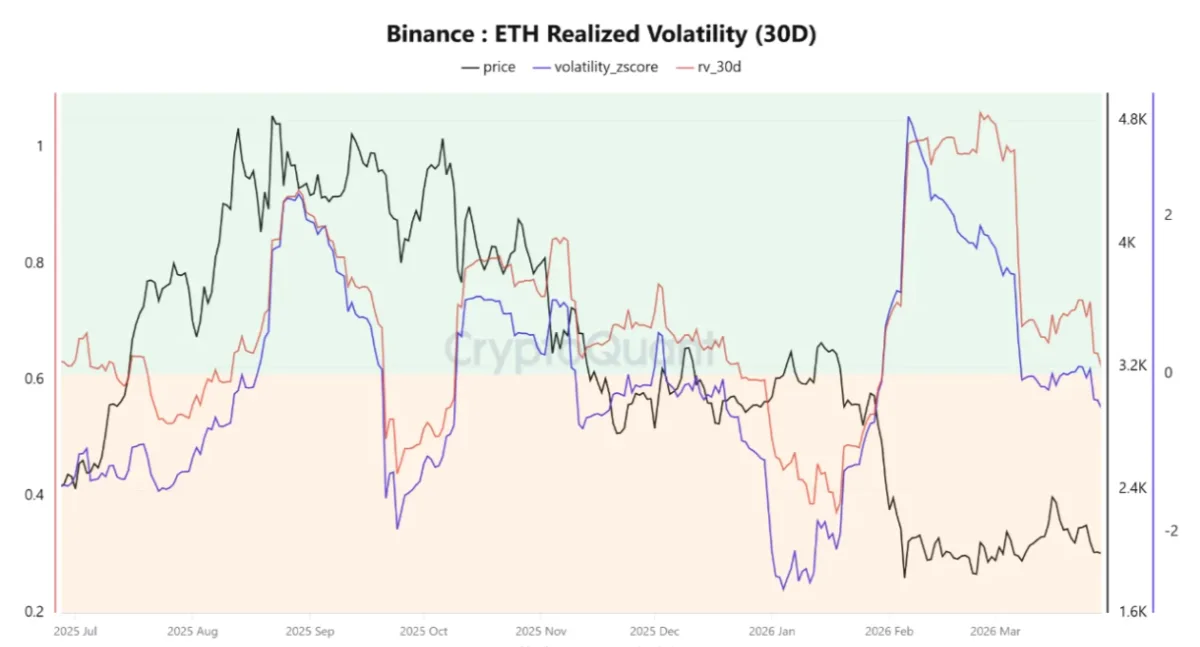
CryptoQuant analyst Arab Chain observed that such periods of market tranquility have historically preceded significant directional moves. The volatility Z-Score has shifted into negative territory at -0.43, positioning below its long-term average.
A comparable volatility compression during the August-September 2025 period preceded an 18% downturn, which gave way to a 25% upward surge within a two-week span. December 2025 witnessed a similar volatility contraction that catalyzed a 20% price appreciation.
Critical Support and Resistance Zones
Analyst Ted Pillows shared on X that upward price bounces continue to face swift retracements. His assessment indicated that should ETH surrender the $2,000 threshold, “the dump will accelerate.”
$ETH is looking weak here.
Any bounce is getting retraced quickly, which is a sign that Ethereum wants to go down.
If ETH loses the $2,000 level here, the dump will accelerate. pic.twitter.com/v7tBHpamJw
— Ted (@TedPillows) March 31, 2026
Beneath the $2,000 mark, a substantial support cluster exists between $1,750 and $1,800, housing more than 1.4 million ETH in accumulated holdings, based on Glassnode metrics. A failure of this zone could expose the pathway toward $1,150.
Regarding upside potential, ETH must overcome the $2,100–$2,200 corridor where the 50-day EMA currently resides. Beyond this resistance band, the subsequent objective stands at the March 16 local peak of $2,380.
Investment Product Activity and Geopolitical Developments
US spot Ethereum ETFs documented $4.9 million in net inflows during Monday’s session. This positive flow arrived following eight consecutive trading days marked by net withdrawals approaching $440 million in aggregate.
ETH advanced 4% on Monday in response to statements from Iran’s President Masoud Pezeshkian, who expressed openness to resolving tensions with the US and Israel contingent upon specific assurances. Oil markets retreated 5% on this development while cryptocurrency and equity markets experienced gains.
Ethereum $ETH often bottoms near the 0.80 MVRV band and starts a new bull run after breaking above the Realized Price. pic.twitter.com/1XaBTQcrlJ
— Ali Charts (@alicharts) March 31, 2026
Cryptocurrency analyst Ali Charts highlighted on X that Ethereum typically establishes price floors near the 0.80 MVRV band and initiates fresh bullish cycles after surpassing the Realized Price threshold—a level currently undergoing testing by ETH.
ETH witnessed $95.9 million in aggregate liquidations throughout the preceding 24-hour period, with $52.8 million originating from short position closures, per Coinglass data.



