

Key Highlights
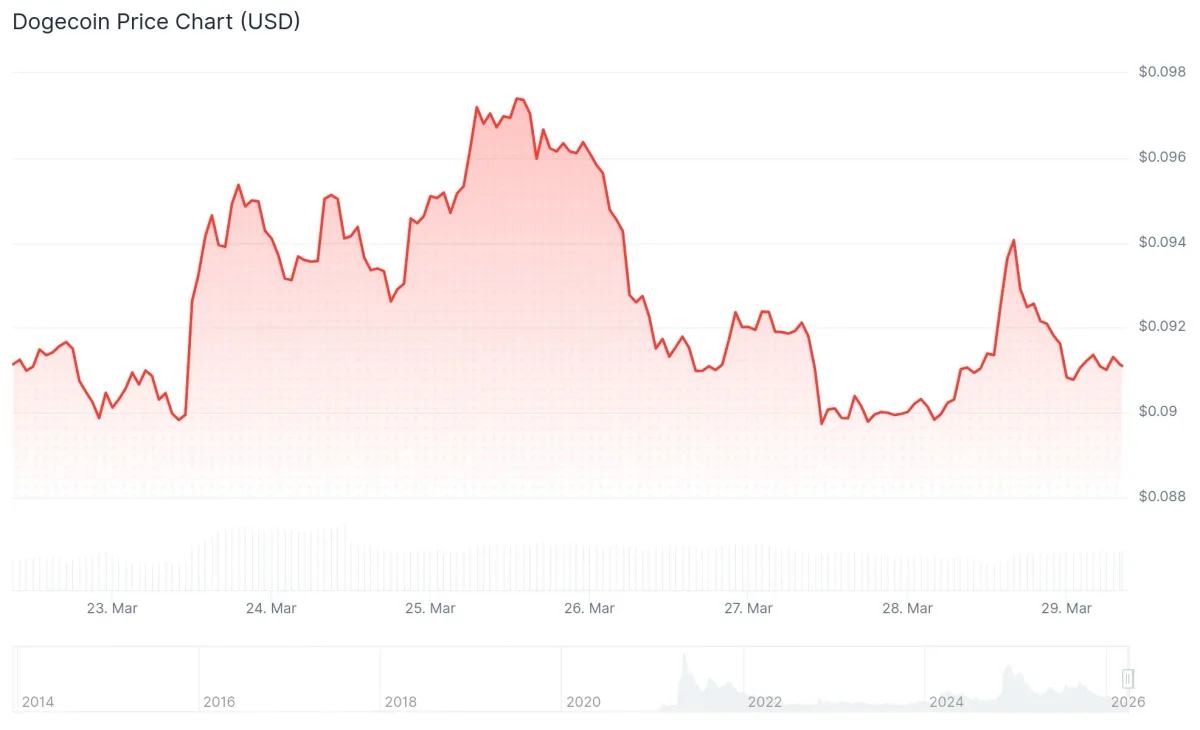
- Dogecoin currently hovers around $0.09106, positioned in what historical cycles identify as a correction and consolidation period.
- Analyst Bitcoinsensus reveals a chart demonstrating how Cycle 3 replicates the structure of Cycles 1 and 2, which delivered gains of 5,800% and 21,000%.
- DOGE maintains a pattern of ascending lows throughout its cycles — Cycle 1 reached bottom around $0.000020, Cycle 2 near $0.00070, and Cycle 3 stays above $0.09.
- Binance trading metrics indicate growing long position interest, with the ratio of longs to shorts climbing across both account counts and trading volume.
- Daily DOGE ETF inflows register zero activity, maintaining total net assets near $9.12 million without new institutional money flowing in.
Dogecoin (DOGE) maintains its position around $0.09106. Recent attention has focused on the meme coin following widespread circulation of a chart posted by crypto analyst Bitcoinsensus, which places three distinct DOGE price cycles in parallel comparison.
The first cycle delivered returns exceeding 5,800%. The second cycle pushed further, posting gains surpassing 21,000%. Both cycles demonstrated identical fundamental structures: gradual accumulation, explosive upward movement, followed by substantial retracement. The third cycle appears to follow this established blueprint.
DOGE topped out during this cycle near $0.70 before entering a retracement phase. The price has subsequently moved lower and currently consolidates within the $0.09 to $0.10 corridor.
$DOGE Macro Cycles Overview 📈🔥#Dogecoin has historically followed repeating cycle patterns, often tracking alongside #Bitcoin
This current cycle seems a bit more prolonged compared to previous ones 🚀
While no outcome is guaranteed, this chart provides a possible roadmap… pic.twitter.com/7TOehiVyQq
— Bitcoinsensus (@Bitcoinsensus) March 27, 2026
A particularly notable characteristic spanning all three cycles involves progressively higher bottoms. The first cycle established its low near $0.000020. The second cycle found support around $0.00070. The third cycle maintains levels above $0.09 throughout its present decline.
This ascending low pattern indicates purchasing activity entering at progressively higher price points with each successive cycle. The behavior signals expanding participation and a broadening holder base developing over time.
Binance Trading Activity Shows Bullish Positioning
Binance platform metrics reveal changing trader positioning dynamics. The ratio of long positions to short positions among leading traders has increased, measured both by participant count and capital allocation. Traders are placing directional bets favoring upward price movement, with some expanding their exposure rather than reducing positions.
Binance Top Trader's $XRP long positions are increasing.
Long and short positions were similar, but now long positions are shifting to the upper hand. pic.twitter.com/kr5bNlEyHC
— CW (@CW8900) March 25, 2026
Such positioning dynamics can signal increasing market conviction, though concentrated directional bets also introduce vulnerability. Markets exhibiting one-sided positioning sometimes experience short-term reversals.
The current data reveals accumulation occurring at present price ranges, indicating deliberate position building rather than reactive trading following price momentum.
Technical Indicators Reveal Compressed Range Awaiting Breakout
Technical analysis shows the RSI hovering near 42 — positioned in neutral territory between oversold and overbought zones. The MACD displays minimal divergence. The ADX reads approximately 15, confirming the absence of directional momentum in either trajectory.
Bollinger Bands display compression, with resistance established near $0.10 and support anchored around $0.09. Band compression typically precedes volatility expansion.
Movement above $0.10 could establish momentum toward $0.15. Breakdown below $0.09 support would activate further downside scenarios.
Regarding ETF activity, daily inflows measure zero. Total net assets remain around $9.12 million showing no expansion. Institutional participation through this vehicle shows no discernible movement.
$DOGE is sitting at generational buying zone (imho)!! There's no reason why this thing can't hit $10+ this cycle! #DOGE has done 100x before, it can do it again. pic.twitter.com/Kkox1VuG9i
— Vuori Trading (@VuoriTrading) March 26, 2026
Analyst Vuori Trading shared commentary on X describing DOGE‘s current level as a “generational buying zone,” projecting potential for the asset to reach “$10+ this cycle.”
ETF activity maintains zero daily inflow, with aggregate net assets steady near $9.12 million.



