

Key Takeaways
- A falling wedge pattern has emerged on DOGE’s daily chart, a formation that often leads to significant price movements.
- Resistance zones between $0.105 and $0.11 align with critical Fibonacci retracement levels.
- RSI metrics show recovery from oversold conditions toward neutral territory, displaying modest bullish momentum.
- The 50-day EMA presents a significant overhead obstacle, with a successful reclaim needed to confirm any trend reversal.
- As of March 18, DOGE was valued at approximately $0.094, reflecting a nearly 5% decline over 24 hours.
Dogecoin has entered a consolidation phase around the $0.10 mark, developing a technical formation that market participants are monitoring with interest. The structure carries historical significance based on previous price behavior, though immediate direction remains uncertain.
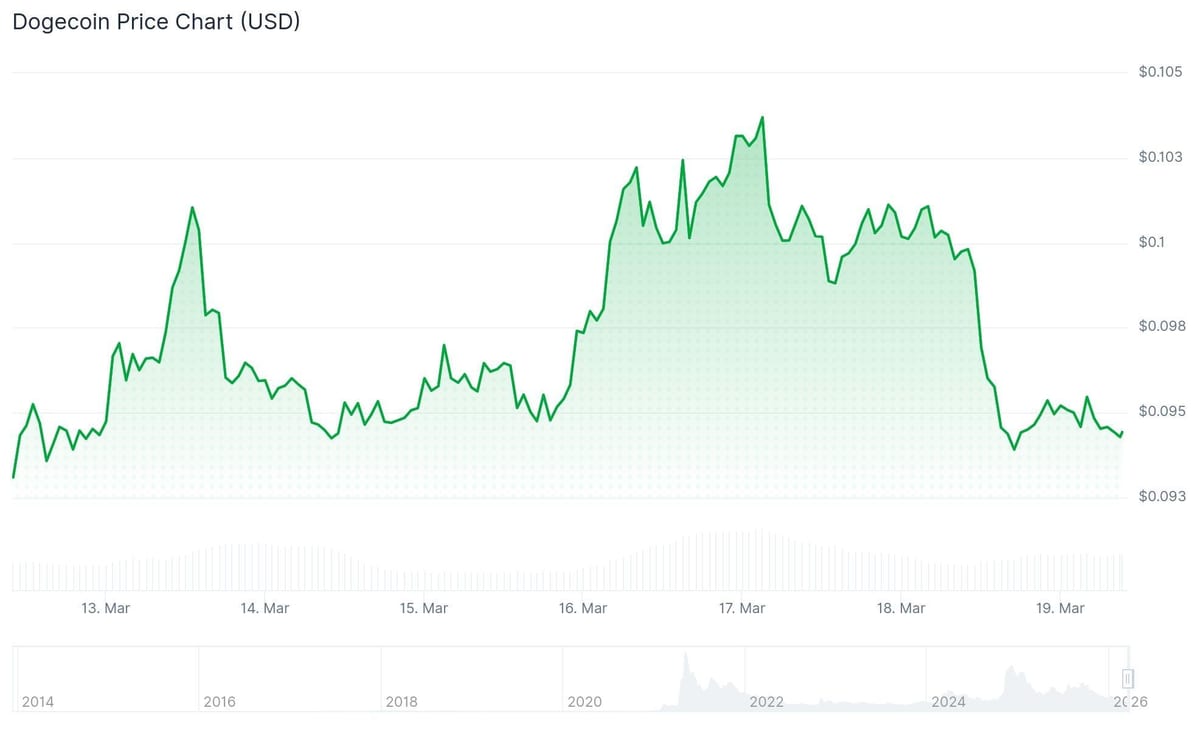
The daily timeframe reveals what technical analysts identify as a falling wedge formation. This pattern develops when an asset creates descending peaks while the troughs converge toward a narrower range. Such compression typically precedes a directional breakout. Market participants who weathered the recent decline anticipate an upward resolution.
The pump on $DOGE should trigger a very nice meme season, historically. pic.twitter.com/lMCUCo34aV
— ray 🐂 (@moonbag) March 18, 2026
This compression phase initiated following a correction period that came after substantial gains earlier in the cycle. Throughout this period, Dogecoin has displayed diminishing highs accompanied by reduced selling intensity, indicating potential exhaustion among bearish participants.
Overhead Barriers Remain Intact
The primary obstacle for any price recovery sits between $0.105 and $0.11. This region corresponds with the 0.5 through 0.618 Fibonacci retracement measurements derived from the latest downward move. The zone also coincides with clustered exponential moving averages on shorter timeframes, creating a concentrated resistance barrier.
Once you see this Dogecoin $DOGE fractal, you can't unsee it! pic.twitter.com/ML2zpQV1He
— Ali Charts (@alicharts) March 18, 2026
The $0.10 threshold has been challenged numerous times throughout the past year. Previous attempts to sustain levels above this mark encountered renewed selling pressure that drove prices lower. Technical observers note this pattern has diminished the reliability of $0.10 as a foundational support level.
Breaking decisively above $0.11 would expose $0.116 as the next target, followed by $0.136. Currently, the price remains beneath the 50-, 100-, and 200-day moving averages, maintaining the broader bearish structure.
March 18 data showed DOGE trading around $0.094, representing a 4.84% intraday decline.
The 50-Day EMA Presents a Critical Challenge
Clearing the $0.11 level would still leave DOGE facing the 50-day EMA positioned directly overhead. This moving average has traced the downtrend trajectory throughout the correction phase. Because this indicator adjusts continuously with price action, maintaining any breakout above it proves challenging.
Previous cycles demonstrate that recapturing the 50 EMA typically provides the first legitimate indication of a trend transition in DOGE. Absent this confirmation, market analysts view any movement above $0.10 as temporary relief rather than a true reversal.
RSI readings have climbed from oversold territory and currently hover near the centerline with subtle bullish characteristics. The MACD indicator shows signs of a potential bullish crossover as well, pointing to diminishing downward pressure.
Current data confirms DOGE maintains its position above the longer-term support foundation at $0.086, representing the most recent local bottom before the present rebound attempt.



