

Key Highlights
- Between March 23 and April 5, 2026, Chainlink secured 18 fresh integrations spanning 22 blockchain networks
- The LINK reserve wallet accumulated 2.93 million tokens via revenue from both on-chain and off-chain sources
- Exchange-traded fund activity recorded consistent inflows with no withdrawal events
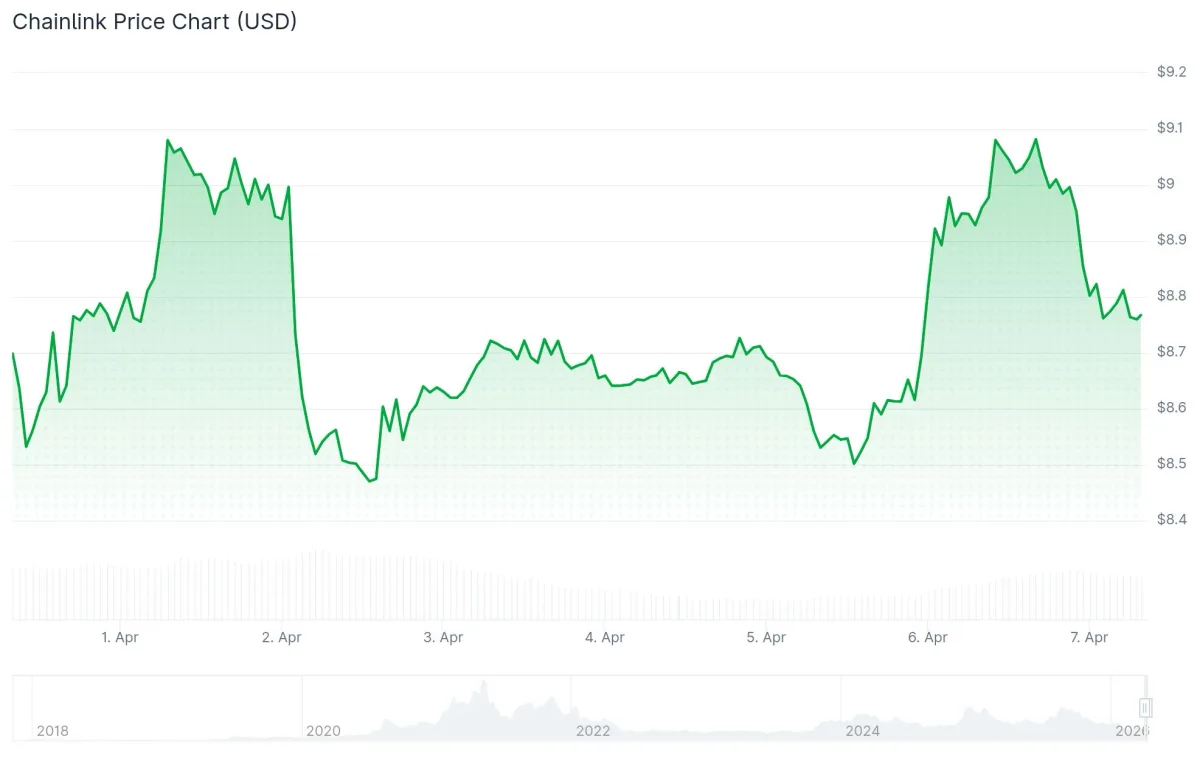
- Current LINK valuation stands at $9.08, reflecting a 6.21% daily increase alongside $494 million trading volume
- Technical observers highlight $10.40 as the primary resistance target while $8 remains the crucial floor level
Chainlink maintains a consolidation pattern within a defined price corridor, bound by $8 floor support and $10 overhead resistance. At press time, the LINK token registered $9.08, climbing 6.21% over 24 hours and outperforming Bitcoin’s 4.05% daily advance.
During the window from March 23 through April 5, 2026, Chainlink validated 18 protocol integrations distributed across nine service categories and 22 blockchain ecosystems. Participating platforms include Aave, Coinbase, GMX, Takadao, and Vyro, covering decentralized finance, perpetual contracts, asset tokenization, and exchange frameworks.
[[SCRIPT_0]]
Chainlink CBO Eid Johann revealed during a recent discussion that Chainlink infrastructure underpins approximately 80% of blockchain ecosystem security. Oracle services have processed nearly $28.6 trillion in cumulative transaction value from early 2022 forward, while smart contracts utilizing LINK oracles currently safeguard close to $61 billion in digital assets.
As of April 2, the Chainlink Reserve wallet contained 2.93 million LINK tokens, built through combined on-chain and off-chain revenue streams. Exchange-traded fund monitoring indicates exclusive inflow activity with zero recorded outflows throughout the tracking period.
Technical Perspectives from Market Analysts
Analyst Don characterized LINK as operating within a compact accumulation zone. His charting work identified a recurring sequence of descending wedge formations preceding explosive price action, establishing an initial objective at $10.40. Subsequent targets extend to $25.36 and $48.37 assuming pattern continuation.
[[SCRIPT_1]]
The Moon Show identified a significant bottom formation near $8.20 on the four-hour timeframe. The outlined approach involves monitoring for a liquidity grab beneath that threshold before initiating long positions. When that assessment published, LINK traded at $8.55, positioned above a demand area validated repeatedly since February.
Crypto analyst Ali Charts observed Bollinger Band compression on the LINK three-day chart, indicating substantial price movement approaching.
[[SCRIPT_2]]
Liquidation Clusters Define Battle Lines
The liquidation density map reveals concentrated leverage positioning at both $8 and $10 price levels. A decisive move below $8 could initiate cascading liquidations toward $6 as leveraged longs unwind. Conversely, a sustained push above $10 creates a pathway toward $12 and $14 through forced short closures.
LINK’s 6.21% Monday advance coincided with a 73.51% expansion in trading volume, eliminating low-conviction drift scenarios.
The CLARITY Act, advancing through legislative channels in Congress, may establish LINK’s commodity status within federal law, representing a potential institutional adoption driver according to market observers.
A verified daily close exceeding $10.40 would probably trigger strategic repositioning among short-side traders throughout the marketplace.



