
Key Highlights
- Cardano trades near $0.24 following two weeks of downward movement
- Large holders added 230 million ADA tokens during the Wednesday through Monday period
- Long-to-short ratio stands at 1.14, indicating bullish positioning among traders
- Price continues trading beneath major moving averages with RSI at 41 showing limited strength
- Market analyst Ali Charts identified a channel breakdown suggesting possible decline to $0.22
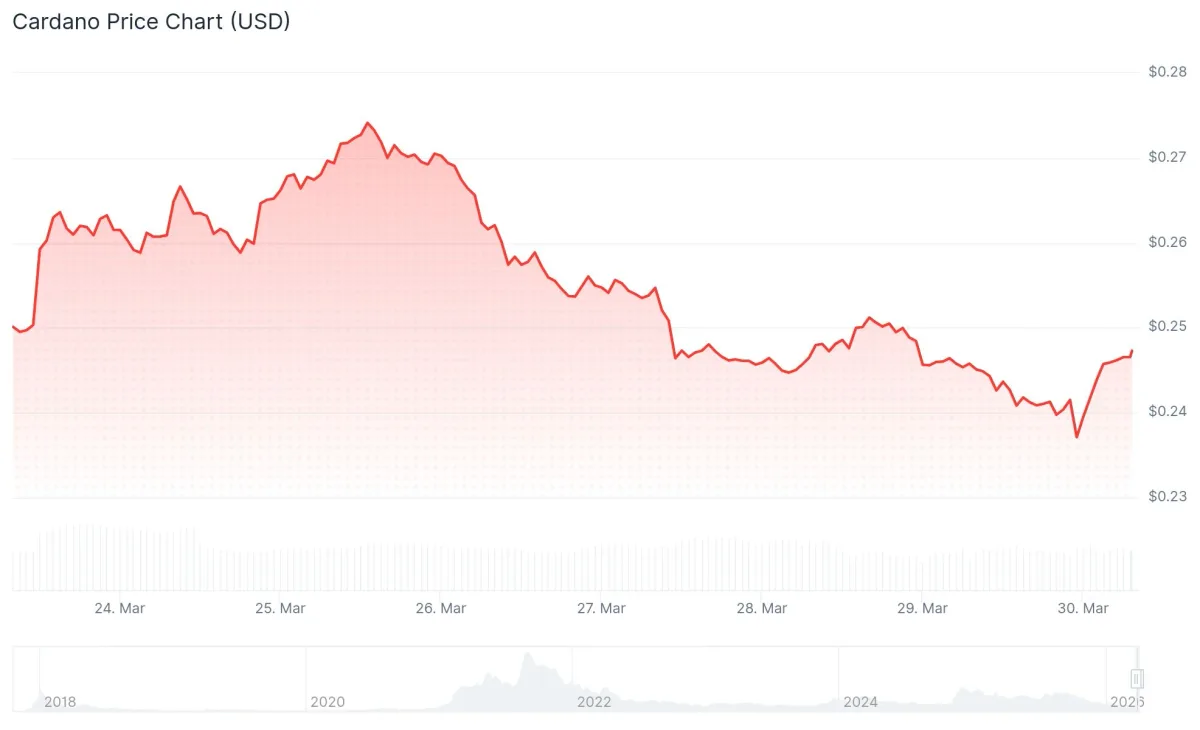
Cardano (ADA) hovers around the $0.24 mark on Monday, showing modest recovery following a fourteen-day decline. The asset has experienced over 4% losses throughout the past week, while technical metrics maintain a bearish orientation.
Despite subdued price performance, certain blockchain metrics reveal growing attention from substantial token holders. Santiment analytics indicate that whale wallets containing 100,000 to 1 million ADA, alongside those holding 10 million to 100 million ADA, collectively acquired 230 million tokens during the Wednesday to Monday timeframe.

Meanwhile, wallets containing 1 million to 10 million ADA reduced their holdings by approximately 30 million tokens during this same window, suggesting potential selling pressure from this particular segment.
Regarding derivatives activity, CoinGlass analytics reveal ADA’s long-to-short ratio at 1.14, approaching its highest level seen in more than 30 days. This metric above the 1.0 threshold indicates stronger positioning for upward movement compared to downward bets.
CryptoQuant information displays a largely balanced market with minor bullish leaning, featuring significant whale transactions across both spot and futures platforms.
Chart Indicators Display Continued Weakness
Despite these metrics, price action presents a more reserved outlook. ADA remains positioned beneath both the 50-day and 100-day exponential moving averages, with both indicators pointing downward.
The RSI measures 41, demonstrating limited momentum while avoiding oversold conditions. The MACD line has declined beneath both the signal line and zero threshold, with the histogram displaying fresh downward force.
Near-term support rests at $0.23. Breaking through this floor could drive Cardano down to $0.22. For upward movement, resistance appears at $0.26, with stronger opposition around $0.29.
Market Analyst Identifies Channel Breakdown
Cryptocurrency analyst Ali Charts shared on X that Cardano has breached its established price channel, with this development creating potential for movement toward $0.22. This observation was posted approximately 12 hours prior and corresponds with the wider bearish technical configuration observed across various indicators.
Cardano $ADA breaks out of the channel, opening the door to $0.22. https://t.co/qRmIyinaJF pic.twitter.com/hZNoEzDF9g
— Ali Charts (@alicharts) March 29, 2026
ADA reached a support area around $0.237 following rejection from $0.275 earlier during the week. The Chaikin Money Flow indicator has descended significantly into negative range, indicating capital withdrawal from the asset.
Continued testing of the $0.23 to $0.24 support zone progressively diminishes its strength. Should this zone fail, the subsequent major support level appears at $0.20.



