

TLDR
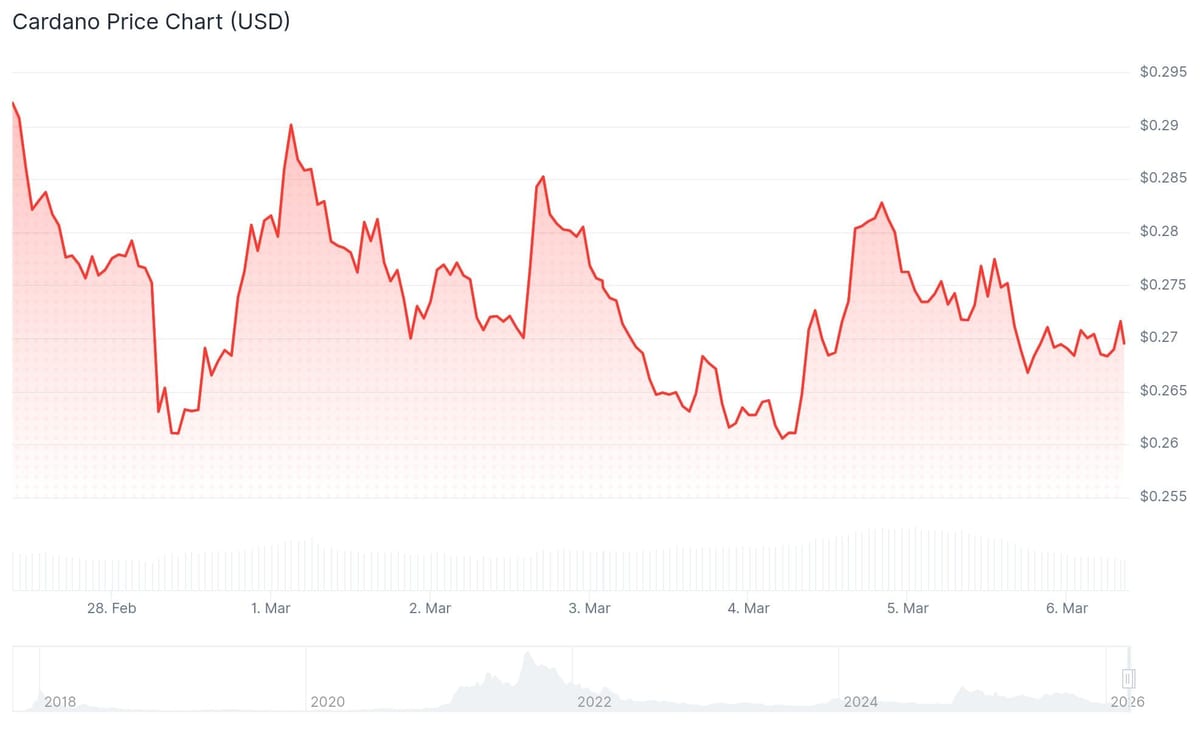
- ADA currently trades near $0.27, testing a descending trendline resistance zone at $0.28 that has blocked upward movement multiple times
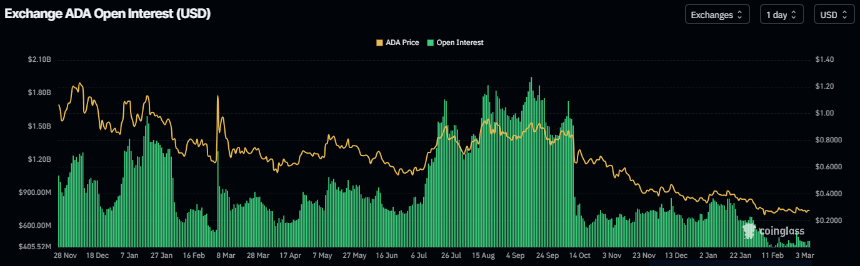
- Futures open interest declined to $462 million with the long-to-short ratio at 0.79, indicating trader pessimism dominates
- Price action continues below both the 50-day and 100-day EMAs, which form a resistance cluster above $0.30
- The RSI indicator reads 46, positioned under the 50 neutral threshold and reflecting subdued momentum
- Manufacturing PMI climbed to 52.4%, marking three straight months of growth over a 40-month period—a pattern that has historically coincided with ADA rallies
Cardano (ADA) holds at $0.27 on Thursday, March 6, as the token tests a critical descending trendline positioned near $0.28. This trendline has previously pushed price lower and remains the primary obstacle for any near-term recovery attempt.
Derivatives markets reinforce the bearish outlook. Open interest in Cardano futures has declined to $462 million, continuing a downward trajectory that began in mid-January.
When open interest contracts while price remains stagnant or declines, this typically indicates reduced trader confidence and market participation.
CoinGlass data shows the long-to-short ratio at 0.79. This reading marks one of the lowest points in more than a month, revealing that short positions outnumber long bets among traders.
ADA continues trading beneath both its 50-day and 100-day Exponential Moving Averages, which cluster above the $0.30 mark. This distance emphasizes the prevailing downward pressure.
The daily RSI stands at 46. Though this represents improvement from oversold conditions, the reading stays below 50, indicating momentum remains insufficient for a sustained recovery.
The MACD shows slight positive values, though the histogram displays minimal movement. This configuration suggests sideways consolidation rather than an emerging directional trend.
Key Price Levels to Watch
Resistance emerges first at the $0.28 trendline. Beyond that, a more significant barrier appears at $0.32, where the declining EMAs intersect.
Breaking above $0.32 with a confirmed daily close would signal a potential shift away from the current bearish formation.
Downside support rests at $0.26, with additional backing at the $0.24 horizontal level. A breakdown under $0.24 would likely trigger additional selling pressure.
Current conditions suggest ADA will likely consolidate between $0.26 and $0.29 absent any external catalyst capable of driving price through resistance.
Macro Indicator Points to Possible Shift
Bitcoin recently climbed above $73,000, reaching a one-month peak, yet ADA failed to mirror this strength. The token posted minimal gains and couldn’t secure a close above its prior daily candle.
Altcoins have been through one of the longest periods of economic suppression in decades.
Crypto survived all of this.
QT, macro tightening, economic slowdown, and altcoins are still here.
So the question is simple:
What happens if the economy actually starts expanding again?… pic.twitter.com/1bvFsC2WcP
— Dan Gambardello (@dangambardello) March 4, 2026
Market analyst Dan Gambardello highlights the manufacturing Purchasing Managers Index (PMI) as a significant indicator for Cardano’s medium to long-term trajectory.
The PMI, measuring manufacturing sector vitality, currently registers 52.4%. This represents three consecutive months of expansion across a 40-month timeframe.
Gambardello observes that previous PMI growth cycles have consistently aligned with positive price movements for ADA.
The present situation bears resemblance to the 2019 correction phase, during which ADA experienced red monthly candles in six out of seven months before staging a substantial recovery.
Quantitative tightening concluded in December 2025. Gambardello suggests this development, paired with ascending PMI readings, creates a macroeconomic environment similar to conditions that preceded Cardano’s previous major bull cycle.
ADA has now recorded six straight monthly red candles after closing February in negative territory.



