

Key Takeaways
- Bitcoin maintains a range between $60,000 and $73,000, with $60K serving as critical support
- Options positioning creates a “negative gamma” environment below $68K that may accelerate downward moves toward $60K
- Technical analyst Aksel Kibar identifies bearish pattern targeting $52,500 upon support breakdown
- Wednesday’s trading brought $174 million in Bitcoin ETF outflows
- Major Bitcoin holders have shifted to net selling, creating negative apparent demand of 63,000 tokens
Bitcoin continues trading within a defined corridor between $60,000 and $73,000, while market structure indicators reveal growing vulnerability. The leading digital asset by market capitalization fell 3.6% to reach $65,709 during Thursday’s session before staging a modest recovery.
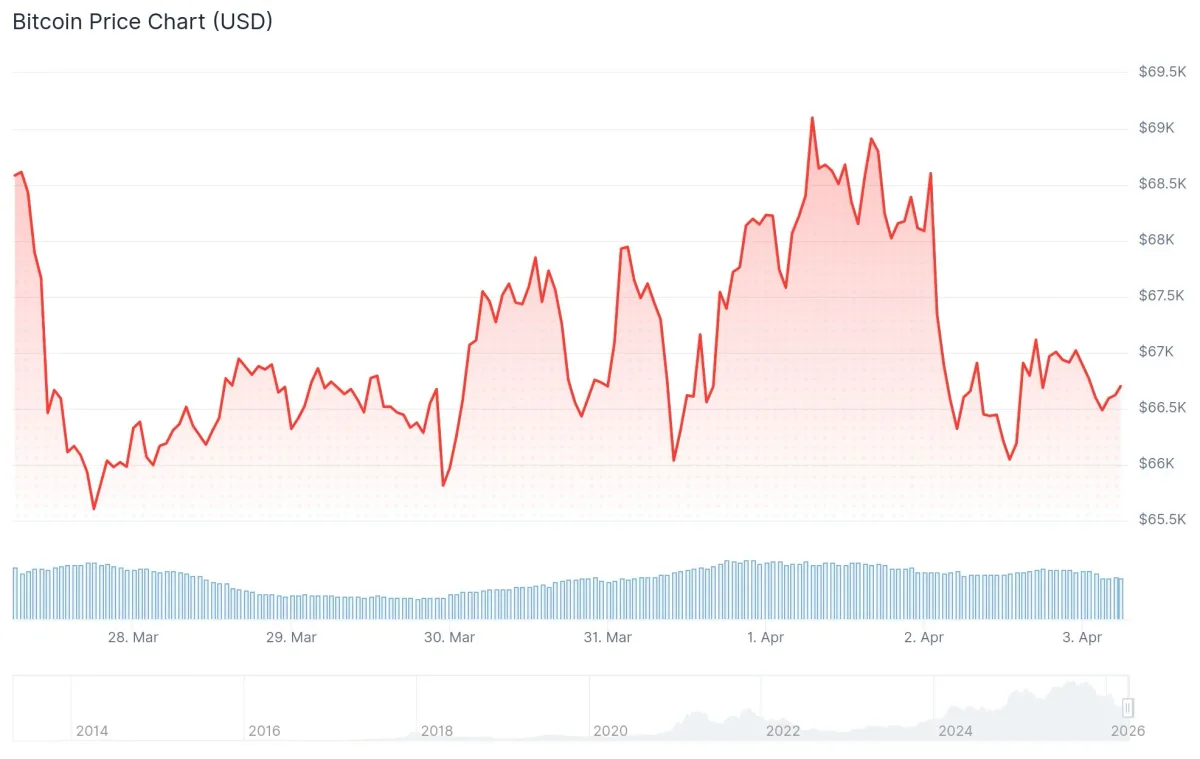
President Trump’s intensified rhetoric regarding Iran has created turbulence across energy markets, pushing WTI crude oil beyond $111 per barrel. Bitcoin responded with approximately 2% decline across 24 hours, settling near $67,000.
According to Alex Kuptsikevich, chief market analyst at FxPro: “Trump’s latest comments on the war with Iran triggered a sharp selloff amid a lack of de-escalation signs.” He observed Bitcoin consolidating within a $66,000 to $69,000 band.
Caroline Mauron, co-founder of Orbit Markets, explained: “Bitcoin is largely following stocks’ direction, though in the past few weeks it has showed reduced sensitivity to both good and bad news.”
Understanding the Negative Gamma Dynamic
Options activity tracked by Deribit and Glassnode reveals substantial put option accumulation spanning from $68,000 down to the mid-$50,000 range. This positioning establishes what market participants describe as a “negative gamma” environment.

The mechanism works as follows: when Bitcoin trades below $68,000, market makers must sell additional Bitcoin to maintain proper hedge ratios. This selling activity creates downward price pressure, which subsequently demands further selling — establishing a self-reinforcing cycle.
Glassnode’s weekly analysis explains: “A move into this zone could trigger accelerated selling as hedging flows reinforce downside momentum, turning what would otherwise be a gradual move into a sharper repricing, with a potential revisit of the $60K level.”
Liquidity conditions remain constrained following the March 27 options expiry, with the Easter holiday period potentially limiting available buying interest to counterbalance selling pressure.
Technical Analysis Points to $52,500 Level
Chartered market technician Aksel Kibar has identified a bearish rising wedge formation developing on Bitcoin’s price chart. His assessment: “Breakdown of the lower boundary will be the signal for a possible move toward $52,500.”
Stick to your discipline. https://t.co/dOu8aYYdLp pic.twitter.com/He1v0vQrJS
— Aksel Kibar, CMT (@TechCharts) April 2, 2026
Bitcoin’s combined open interest across exchanges sits below the $20 billion threshold, matching levels observed during early February when BTC changed hands around $79,000. Hyblock’s liquidation heatmap analysis indicates concentrated long position exposure between $63,000 and $65,000.
Demand indicators paint a concerning picture. CryptoQuant data shows apparent demand reached negative 63,000 tokens by late March. Major holders have adopted net selling behavior throughout the previous year.
Jasper De Maere, a trader at Wintermute, offered this assessment: “Onchain data confirms what price action has been telegraphing: there’s zero conviction.”
US spot Bitcoin exchange-traded funds experienced $174 million in net outflows during Wednesday’s session. While March delivered approximately $1.1 billion in net inflows, these capital flows demonstrate sensitivity to broader macroeconomic developments.
Bitcoin currently trades 45% below its October high of $126,000.



