 Returns to Historic Support Zone That Fueled Previous 2,200% Surge")
TLDR
- SOL hovers around the $80–$85 range, a historically significant accumulation zone from previous cycles.
- Short position concentration appears between $84 and $87 according to liquidation data.
- Bulls need to reclaim $106.24 to confirm renewed upward momentum.
- Crypto Patel highlights SOL’s return to the accumulation zone that preceded a 2,200% gain in the previous cycle.
- Technical analysis reveals a major triangle formation with potential targets between $250–$300 upon successful breakout.
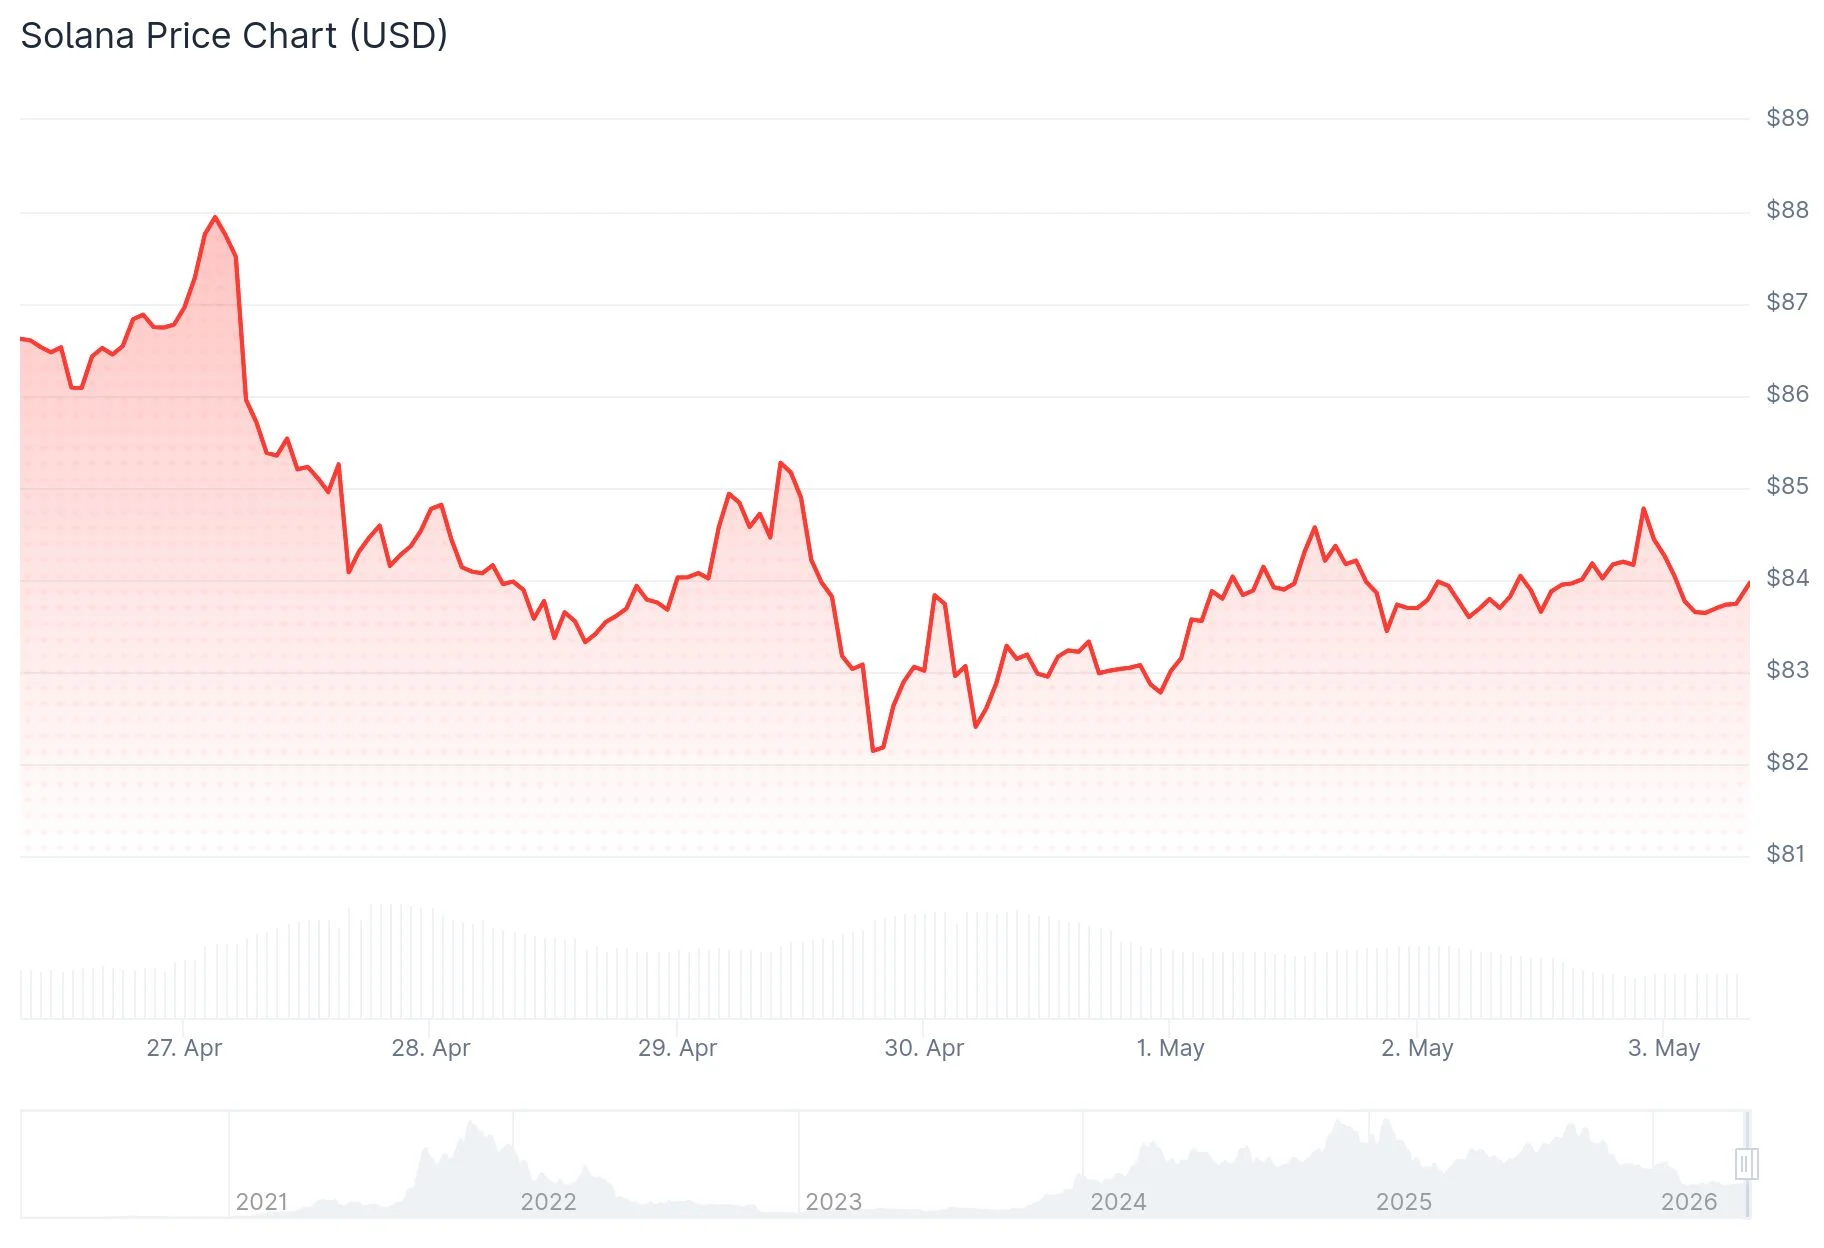
Solana currently trades within the $80 to $85 range at press time, a price zone that has demonstrated historical significance across multiple market cycles. The asset has declined over 70% from its 2025 peak values, bringing it back to this familiar territory.
SOL has visited this price region before with notable consequences. During 2021, the asset climbed from single-digit levels to exceed $250. Following a significant correction in 2022 that brought prices near $10, the asset recovered and eventually reached new cycle highs approaching $290.
Crypto Patel, a prominent analyst on X, recently highlighted this historical pattern. His latest post stated: “$SOL is back at the same buy zone that pumped it 2,200% last cycle. Will it hit $1000 in alt season?” The observation underscores how this price range has repeatedly functioned as a foundation for substantial upward movements.
Key Levels to Watch
Liquidation data from CoinAnk reveals concentrated short positions within the $84 to $87 range. Price action touched approximately $81 before moving back toward that upper cluster. These heatmaps identify zones where leveraged traders face potential forced closures when price reaches specific thresholds.
Analyst Don presented a technical chart identifying $106.24 as the critical resistance SOL must overcome. Breaking above this threshold would validate a shift toward bullish momentum. Beyond $106, the next significant target lies at $260.17, though substantial ground remains to cover. Failure to maintain current support could send the asset back toward $80 or potentially lower levels.
Triangle Pattern Adds More Pressure
Analyst Javon Marks presented a chart illustrating SOL confined within an extensive triangle formation. This technical structure displays converging trendlines created by descending highs and ascending lows over an extended timeframe, typically preceding significant directional moves.
Solana currently trades near the lower boundary of this triangle, within the $75 to $85 range. Successful defense of this support zone points to potential breakout targets around $250 to $300. Conversely, a breakdown below the mid-$60s would invalidate the pattern and bring the $45 region into consideration.
At press time, SOL maintains position within the current support zone spanning $80 to $90, with $106.24 standing as the critical resistance level bulls must recapture to shift momentum.