 Reaches Critical 5-Year Demand Zone as BitMine Accumulates")
TLDR
- Ethereum (ETH) hovers around $1,820, touching a 5-year demand zone previously active during the 2022–2023 bear cycle
- Technical analysts have identified a hidden bullish divergence on weekly timeframes, a pattern that earlier triggered a 100% price surge
- The market structure remains under seller pressure, with a series of lower highs indicating ongoing downward momentum
- Price action below $1,820 may lead ETH toward $1,740, representing a fresh yearly bottom
- BitMine increased its position by 51,162 ETH over seven days, maintaining its accumulation approach throughout the decline
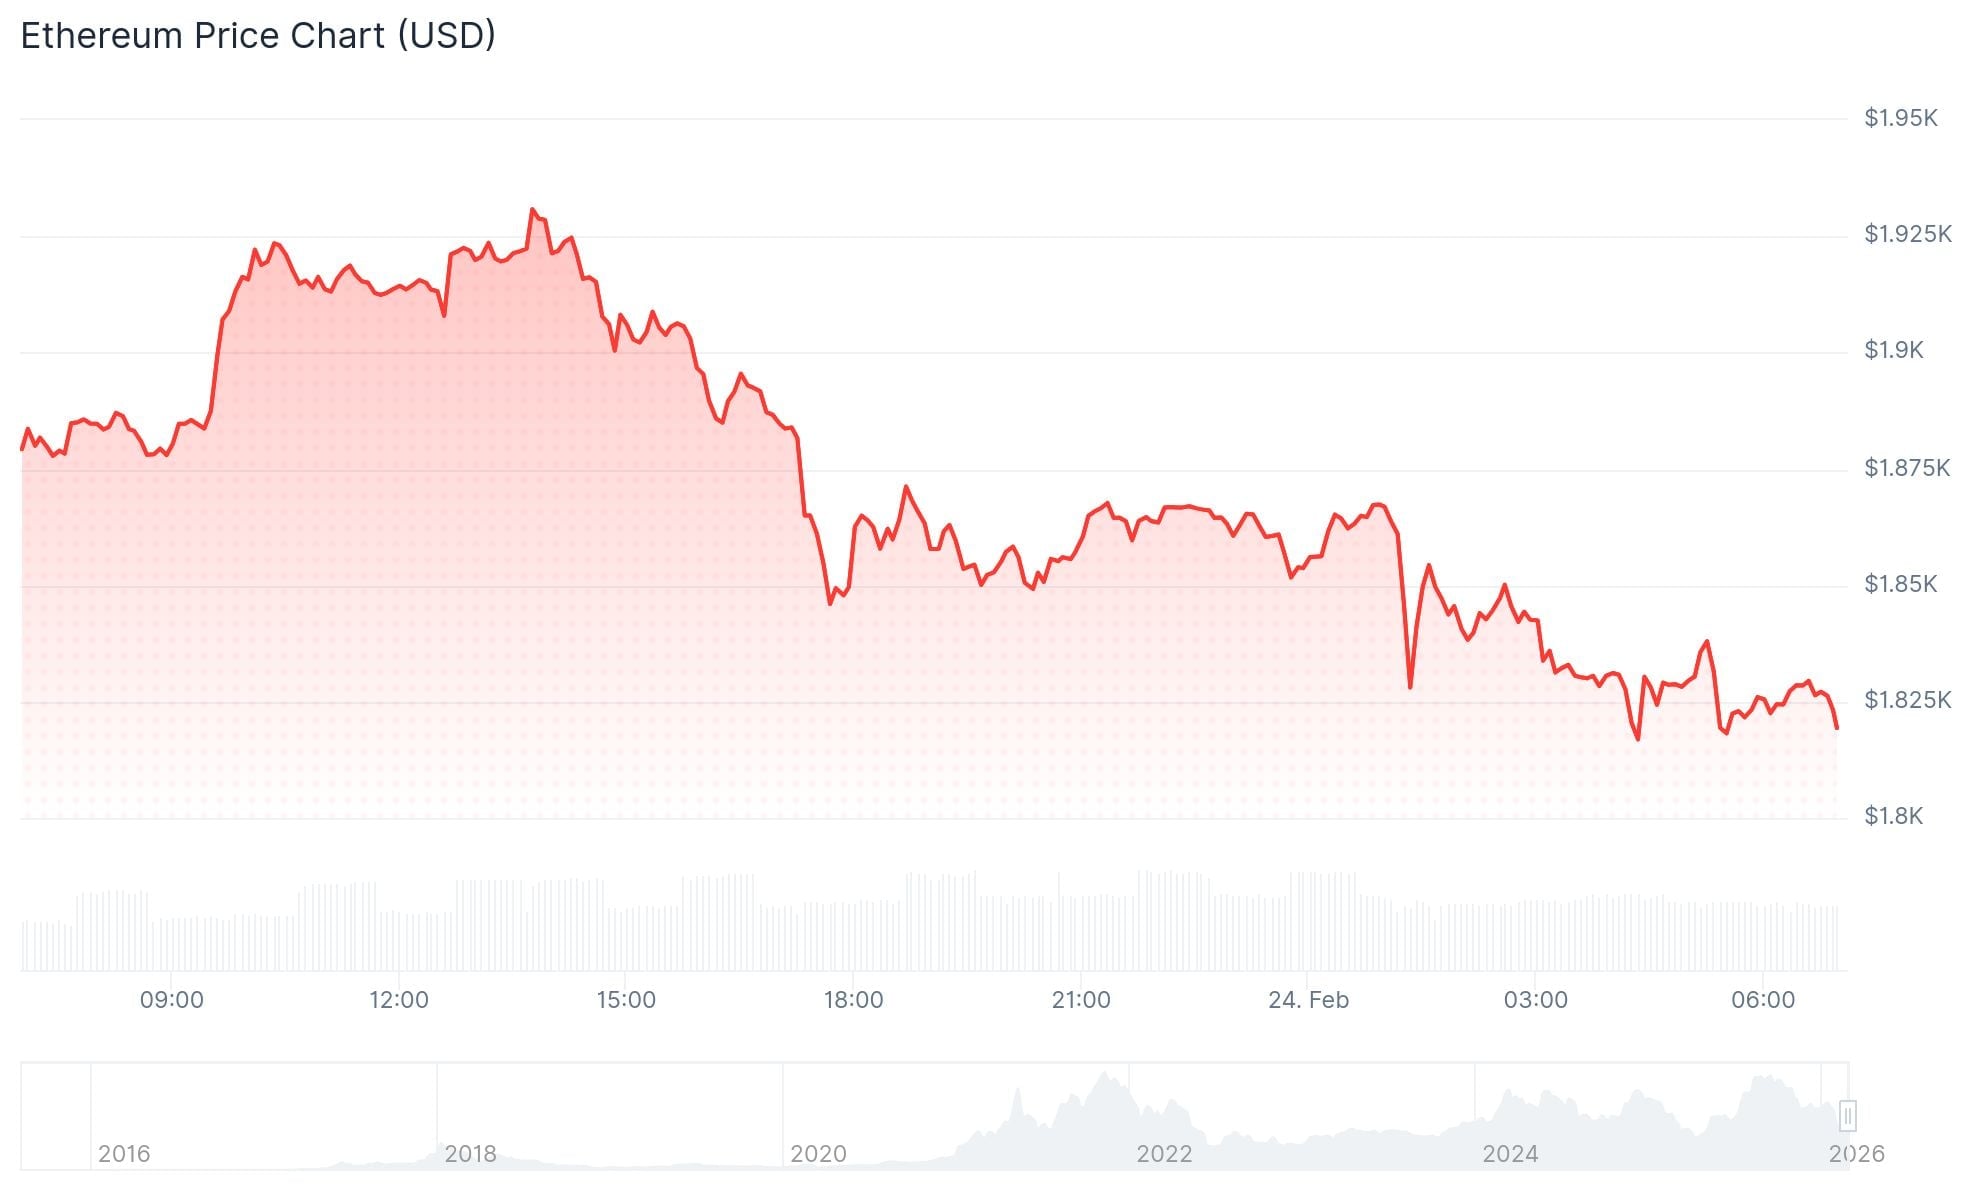
Ethereum touched an intraday bottom at $1,813 before staging a modest recovery to $1,820, positioning the asset at a crucial technical support level drawing significant attention from market analysts.
The current price action brings Ethereum back to territory last visited during the extended bear market spanning July 2022 through November 2023. Technical analysts characterize this region as a sustained demand area rather than a distribution zone.
Analyst Merlijn The Trader highlighted that Ethereum currently occupies a 5-year demand zone. He emphasized that historical data shows this range has served as an accumulation area for buyers.
Meanwhile, the near-term technical outlook maintains bearish characteristics. Ethereum has established a sequence of lower highs following the loss of its value area high, a formation that demonstrates ongoing seller dominance.
The point of control (POC), previously serving as a fair value marker within the trading range, has also been breached. Price action has subsequently rotated downward into the value area low, strengthening the bearish technical case.
The $1,820 threshold has emerged as a pivotal level. This represents one of the final significant structural support zones before a more substantial decline gains probability.
Bears Eye $1,740 as Next Target
Should $1,820 give way, market analysts project the subsequent downside objective at $1,740. This level would establish a new yearly low for Ethereum.
Support zones typically lose strength following multiple tests. Given the persistent bearish momentum and subdued buying activity, $1,820 faces considerable pressure.
A decisive breach beneath this threshold would unlock additional downside potential, with $1,740 emerging as the subsequent zone where demand may materialize.
Analyst Sykodelic identified a hidden bullish divergence forming on the weekly chart. When this pattern last emerged, ETH generated a 100% rally. The timing of any potential move remains uncertain, though.
Investor StockTrader Max characterized Ethereum as having shifted beyond short-term trading opportunities. He framed it as an asset requiring a multi-year investment horizon rather than weeks or months.
Institutions Still Buying
Fundstrat’s Tom Lee operates Ethereum DAT BitMine, which accumulated 51,162 ETH during the previous seven days. The organization stated its commitment to executing its treasury strategy while staking holdings to produce yield.
Tom Lee recognized the challenging price performance while maintaining that crypto markets retain positive catalysts. BitMine continues its purchasing strategy throughout the downturn.
ETH lost its grip above $1,900 earlier this week before declining further. The asset momentarily reached $1,813 before rebounding to $1,820 at current levels.
The cryptocurrency remains in proximity to its February 6 low, while the technical structure has yet to display reversal signals.