 Price Analysis: Key Levels to Watch as Volatility Surges")
Key Highlights
- ETH reached $2,150 on Thursday, marking the week’s highest point while encountering resistance from several technical indicators
- The $2,100 threshold holds significance as it corresponds with the cost basis of wallets containing 100,000+ ETH
- The 30-day realized volatility for Ethereum approaches 0.97, matching levels last seen in March 2025
- Short sellers faced substantial liquidations totaling $220M across two days, accompanied by funding rates shifting into positive territory
- ETF selling pressure shows signs of weakening, though accumulation patterns remain unclear
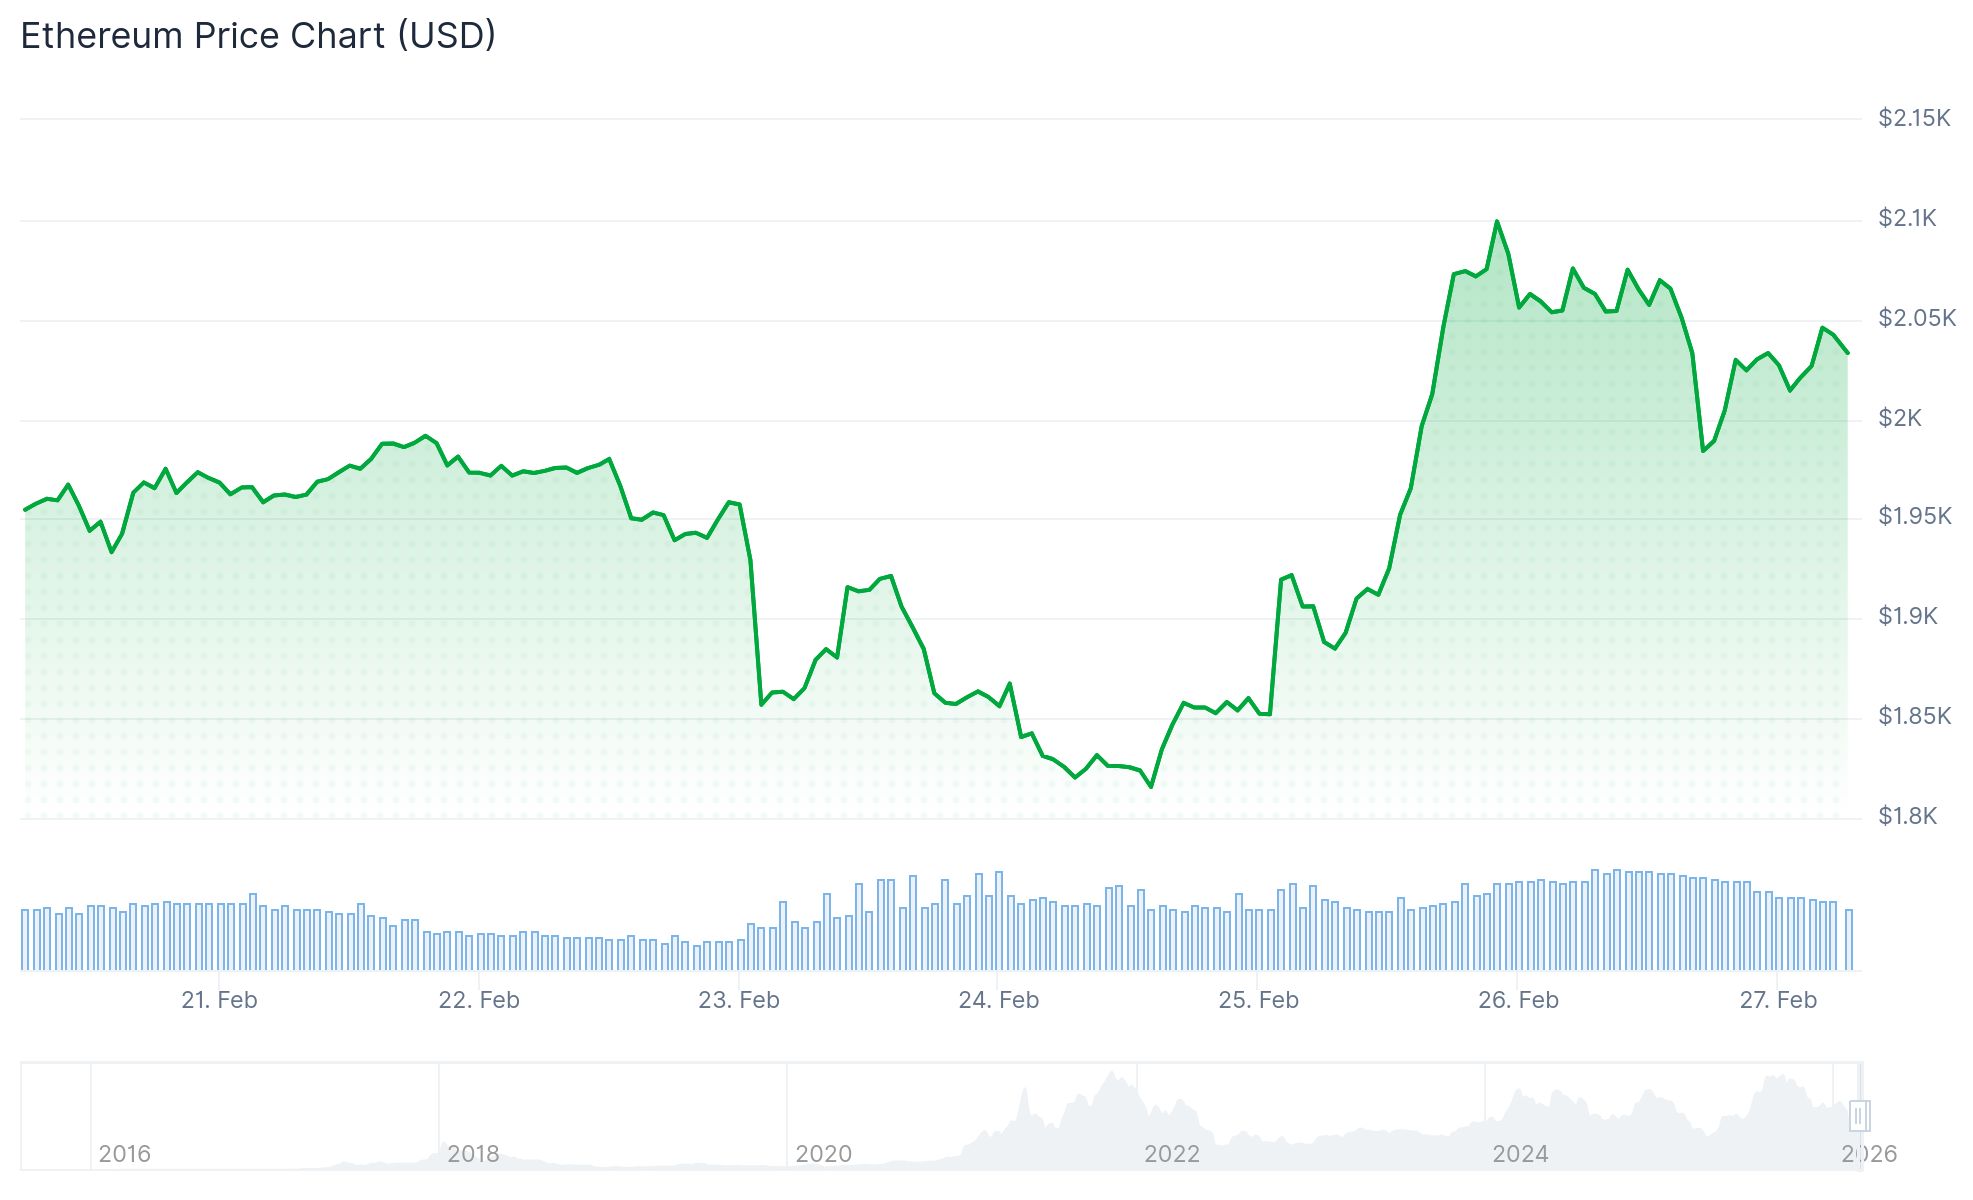
Ethereum reached a weekly peak of $2,150 on Thursday before experiencing a retracement. The asset currently trades within a constrained range, where $2,000 provides foundational support while $2,100 represents the next significant obstacle.
The $2,100 level carries particular importance because it aligns with the realized price for wallets containing 100,000 ETH or greater. Realized price represents the average price at which coins last changed hands, offering insight into whether major holders maintain profitable positions.
Historical data from 2020 onwards shows ETH has only occasionally traded beneath the cost basis of this whale segment, with the 2022 bear market providing the most prominent example. Previous tests of this threshold have typically preceded price recoveries.
Derivatives Market Dynamics
Short position liquidations exceeded $220 million during the previous two days, eliminating substantial leveraged positions. Binance funding rates, which dropped into deeply negative territory earlier this month as short interest accumulated, have reversed course to reach positive 0.23%.
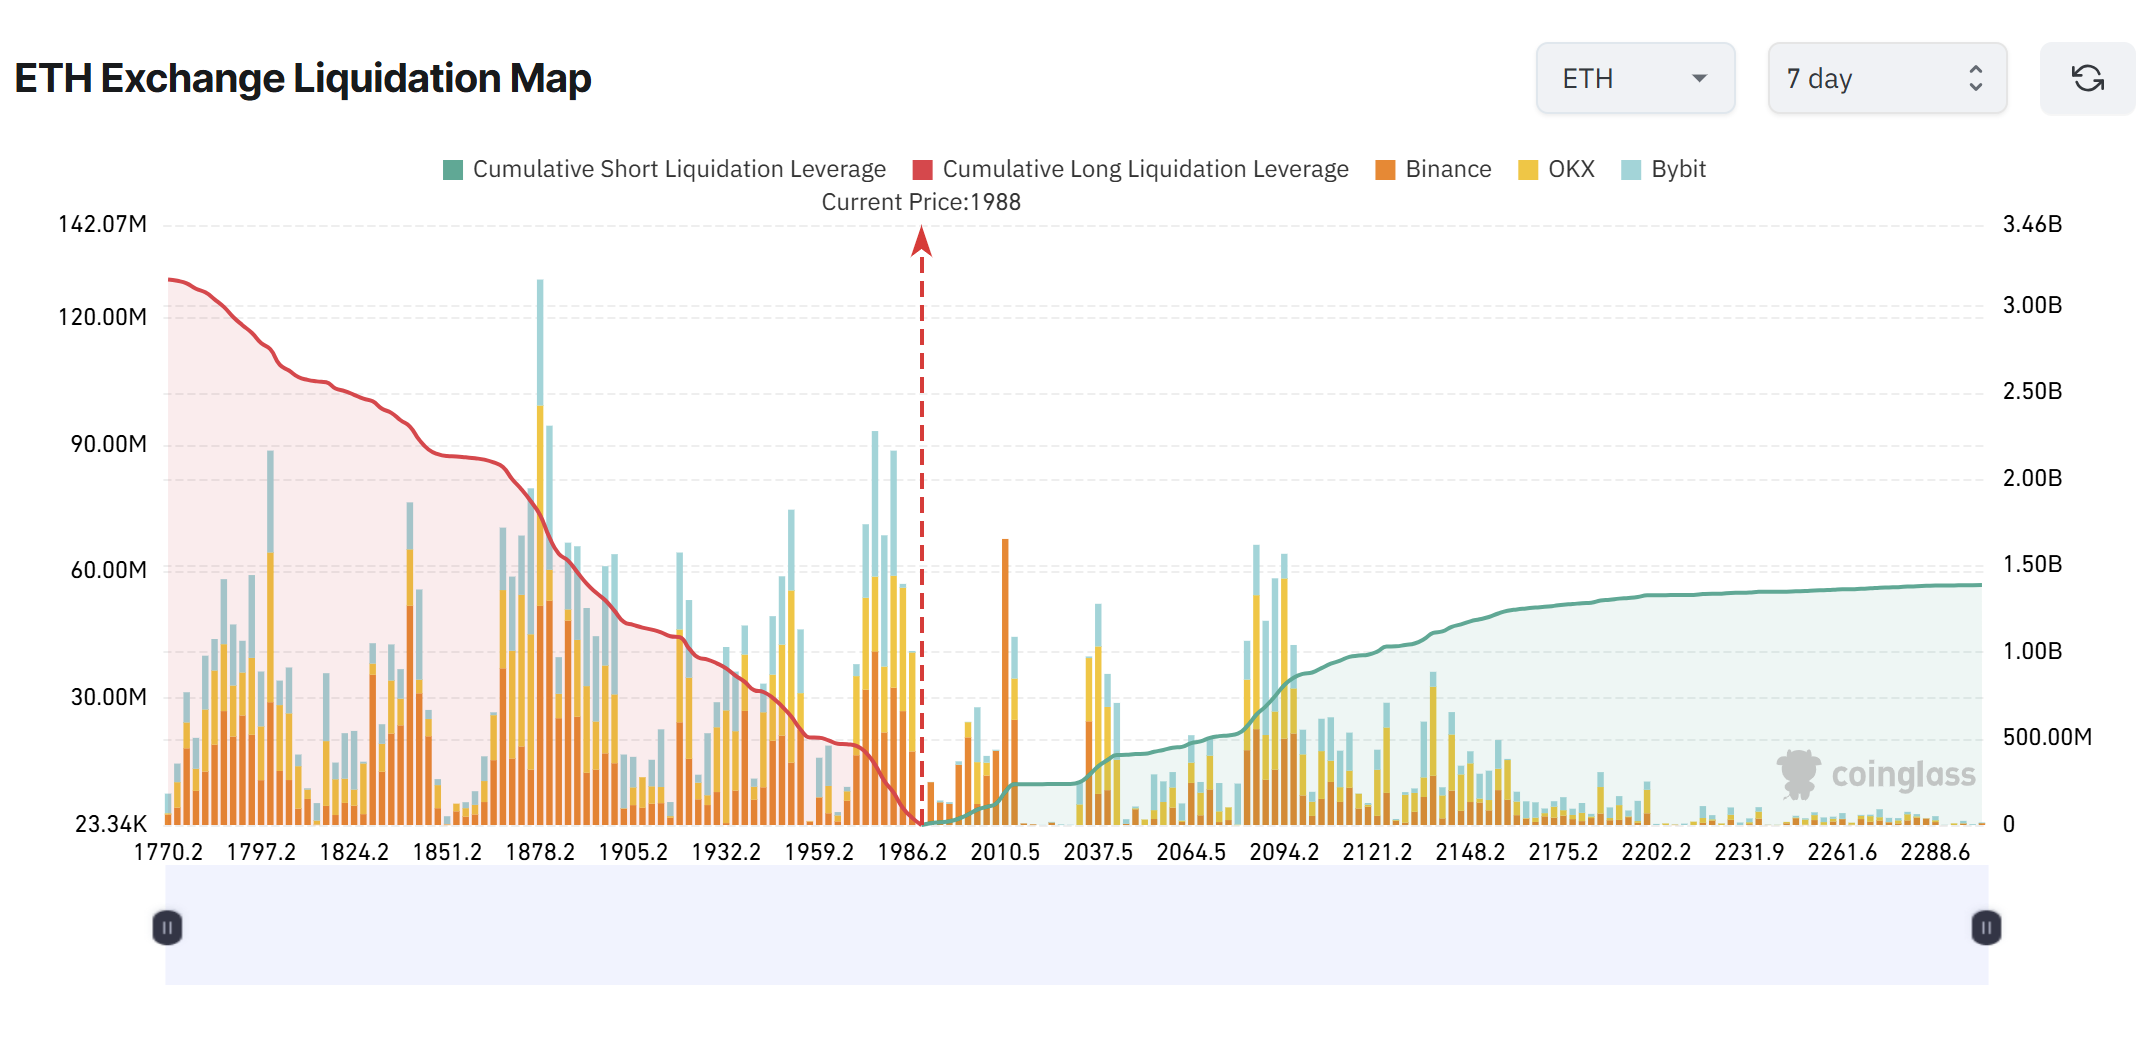
This reversal indicates late-entering short sellers faced forced exits. The current elevated funding rate suggests long positioning dominates, creating potential for long liquidations near $1,800 should upward momentum falter.
Approximately $2.66 billion in long position liquidation exposure clusters around the $1,800 mark, establishing a substantial liquidity concentration beneath present trading levels.
Market Volatility and Investment Vehicle Trends
Ethereum’s 30-day realized volatility on Binance has climbed toward 0.97, representing the highest measurement since March 2025. Heightened volatility at this juncture often indicates markets attempting to establish directional bias.
Price action continues beneath the 50-, 100-, and 200-day moving averages. Each rally following the rejection near $4,800 in late 2025 has formed progressively lower peaks, suggesting persistent distribution pressure.
ETF flow data reveals diminishing selling intensity. Following substantial outflows through mid-2025, recent tracking shows reduced magnitude in both directions. Institutional distribution appears to be moderating, though definitive accumulation signals remain absent.
Analyst Leon Waidmann observed that lower-conviction holders have predominantly departed the market. Short interest continues declining, while high-leverage long positions build slowly.
Technical analyst IncomeSharks identified three resistance zones, encompassing multiple SuperTrend rejections and channel resistance approaching $2,250. The analyst additionally highlighted April lows around $1,500 as a critical level should buying interest diminish.
ETH traded at $2,034 at time of publication.