 Records 12-Year RSI Low: What This Means for Price Action")
Key Takeaways
- DOGE surged past the $0.0924 resistance zone with volume exceeding baseline levels by 176%, establishing this level as fresh support.
- Current price action shows consolidation within the $0.0940–$0.0945 range, with ascending low patterns emerging post-breakout.
- Technical targets point toward $0.0955–$0.0960 on the upside; closing beneath $0.0924 would invalidate the bullish structure.
- The 2-week RSI for Dogecoin has reached its most extreme low since the token’s inception, suggesting potential oversold conditions.
- Technical analysts project a potential recovery toward $0.12 from current oversold territory, with extended chart patterns indicating $0.30 as a possibility.
Dogecoin experienced approximately 5% gains following a decisive break above a resistance barrier that had rejected multiple upward attempts during the trading session. The rally carried DOGE from approximately $0.0926 to peak levels around $0.0950, with the asset subsequently settling into a narrow trading band spanning $0.0940 to $0.0945.
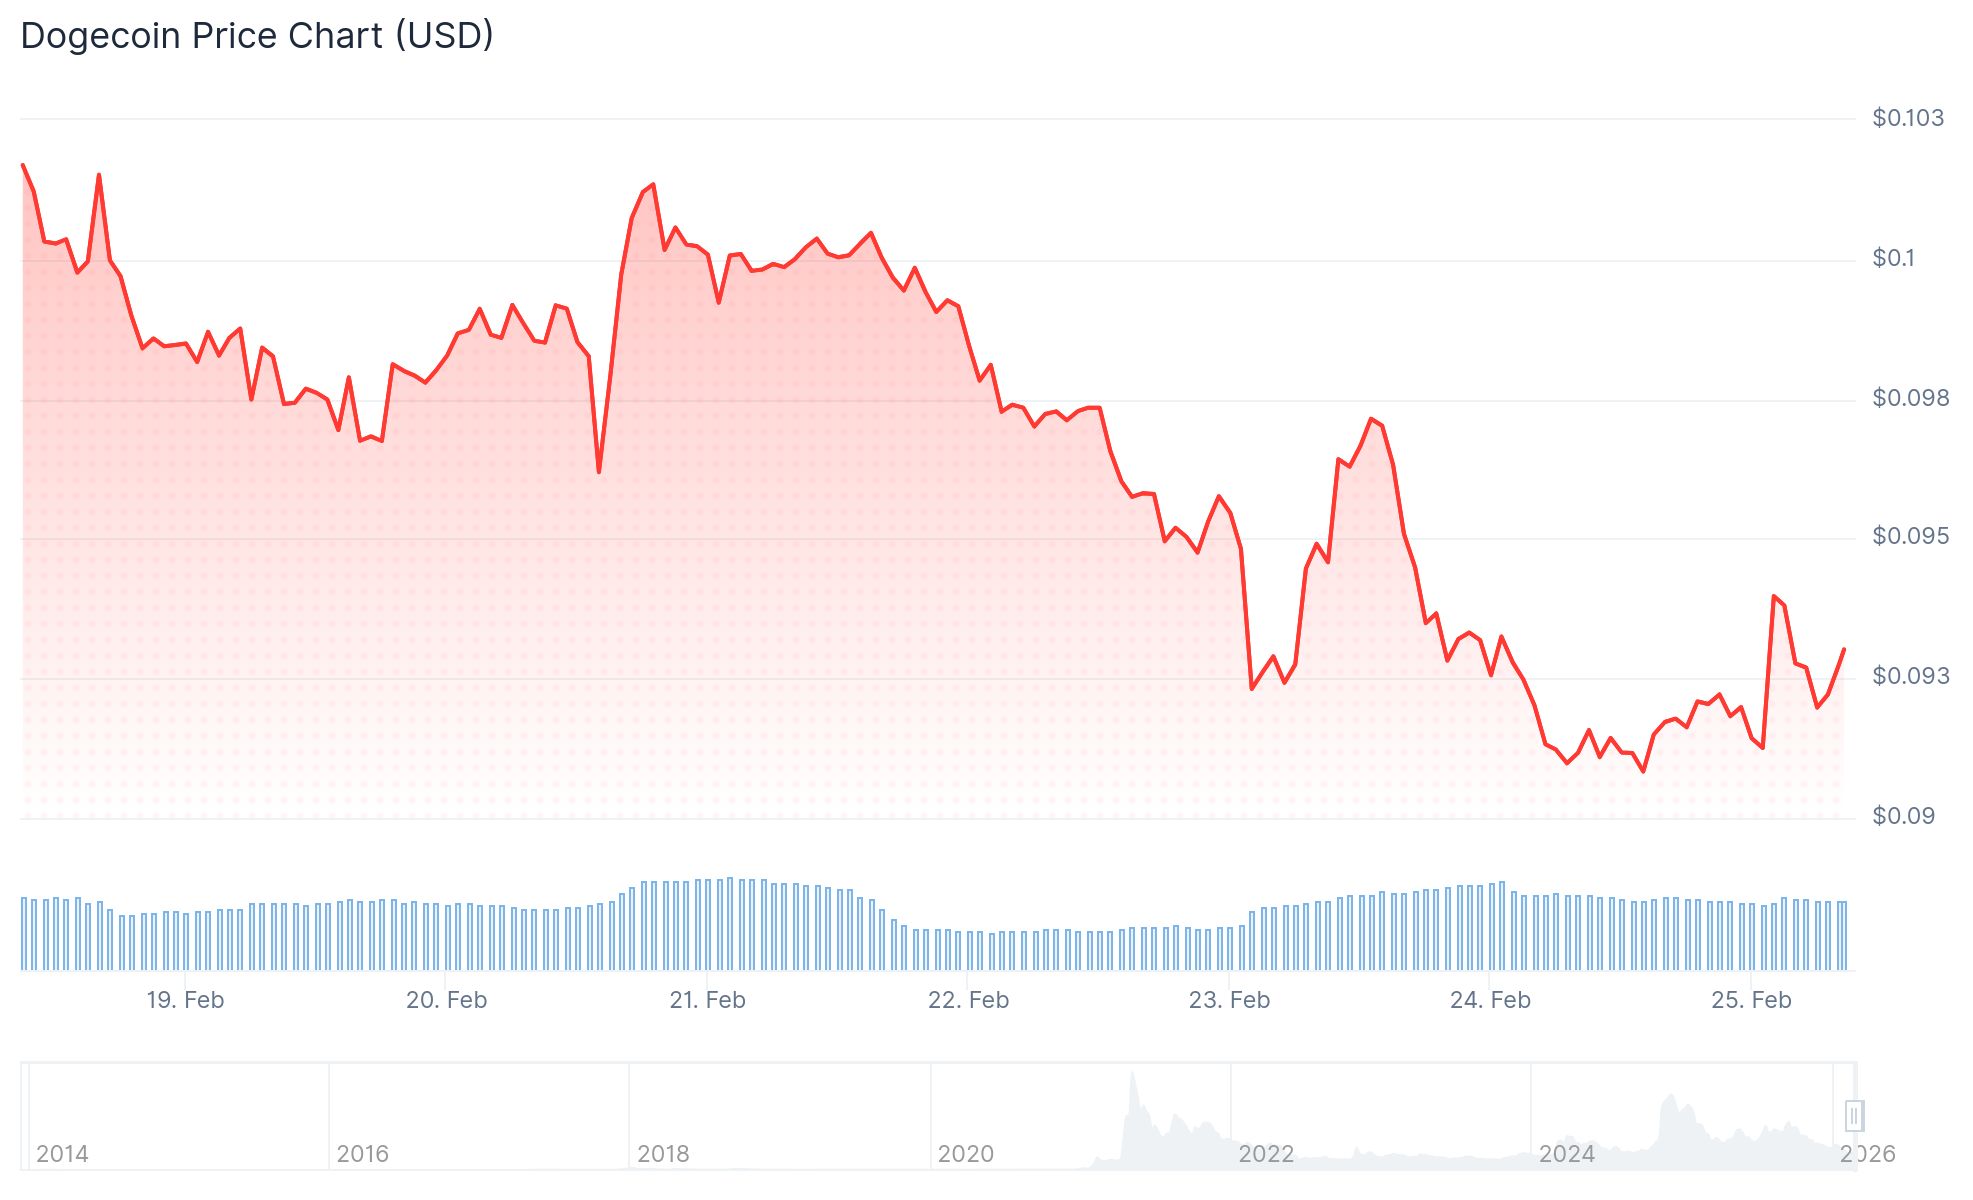
The decisive break through $0.0924 occurred alongside volume of 749 million tokens, representing a 176% surge above standard baseline metrics. This price point has undergone a technical transformation, converting from a resistance barrier into a near-term floor of support.
Ascending low patterns emerged throughout the consolidation window, a formation that market participants generally interpret as evidence of buyer commitment to defending the breakout territory.
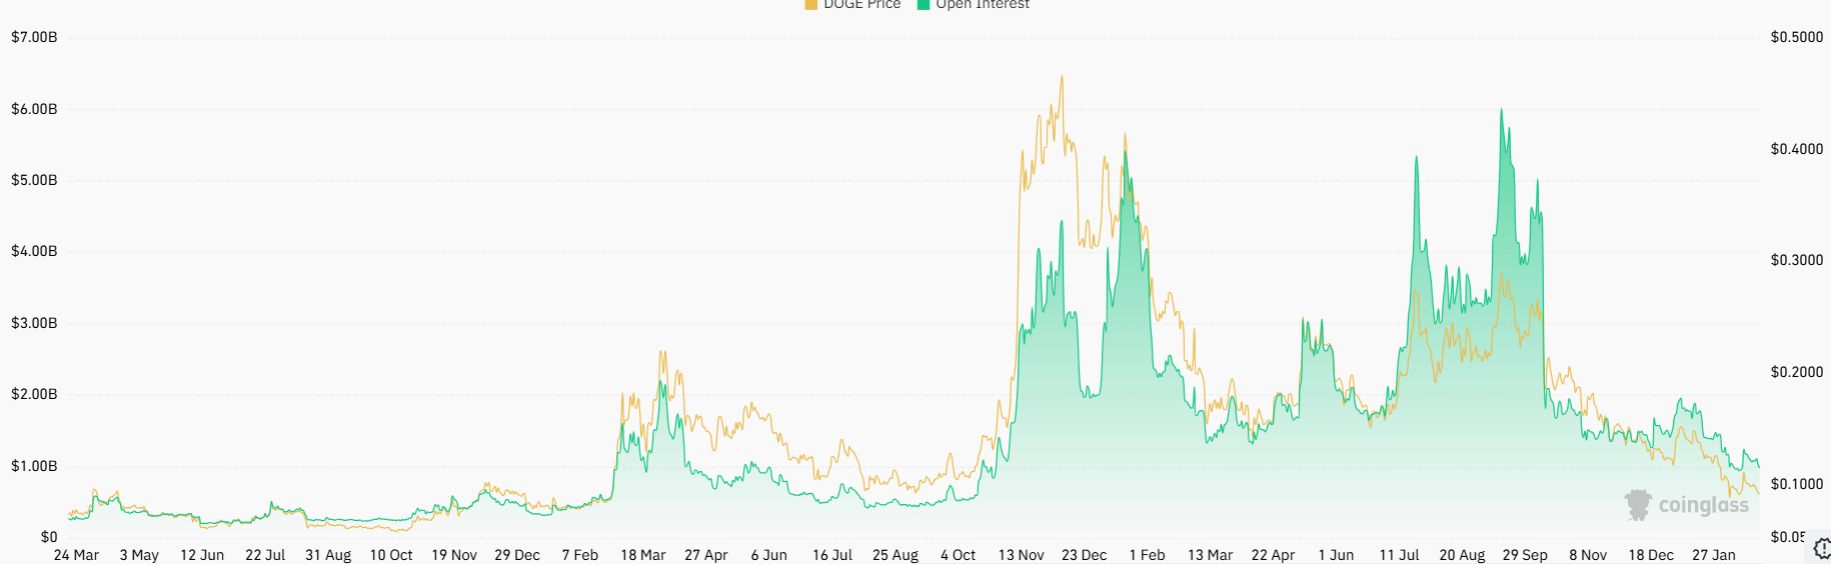
Open interest readings show elevated levels while remaining below extreme thresholds, suggesting measured leverage deployment across the market rather than overcrowded positioning.
Market participants are monitoring $0.0940 as the critical threshold. Sustained trading above this level maintains the short-term technical framework favoring advancement toward the $0.0955–$0.0960 zone.
A reversal below $0.0924 would indicate breakout failure and potentially trigger a retreat into the previous consolidation boundaries.
2-Week RSI Touches Historic Low
Meanwhile, cryptocurrency analyst Cryptollica highlighted that Dogecoin’s 2-week Relative Strength Index has declined to its lowest measurement across 12 years of trading history. The analyst characterized this as the “absolute oscillator floor.”
The RSI indicator has descended to the 34 level on the bi-weekly timeframe. Cryptollica observed that present downside momentum registers as mathematically less intense than readings recorded during the 2015 bear cycle and the March 2020 market disruption.
The analyst stated that selling activity appears to have reached complete exhaustion at present price levels, with DOGE compressing toward a structural foundation that has historically served as a launchpad for significant expansions.
Cryptollica’s extended timeframe analysis illustrates a potential trajectory range featuring a median objective of $0.30 and an upper boundary of $1.30, with a possible bullish pivot window extending from the current period through July 2026.
Technical Recovery Scenario Emerges
Analyst Trader Tardigrade similarly observed that Dogecoin has rebounded from RSI oversold territory. His technical chart suggests a potential recovery movement targeting $0.12.
DOGE accumulated energy through several hours of tight range movement between $0.090 and $0.0927 prior to the breakout sequence. This compression window appears to have generated the momentum fueling the subsequent price expansion.
Current market data shows DOGE trading around $0.0944, maintaining position above the $0.0940 support threshold with ascending low patterns remaining intact.