 Consolidates Near $85: Will Technical Indicators Trigger the Next Major Move?")
TLDR
- Solana (SOL) continues to oscillate within a confined $77–$88 trading corridor spanning nearly four weeks
- Spot Solana ETFs in the United States attracted more than $44 million in weekly capital, pushing total inflows beyond $900 million
- Futures Open Interest for SOL declined over 6% within 24 hours, accompanied by $26.47 million in liquidations dominated by long contracts
- Technical indicators show Bollinger Bands tightening, suggesting imminent volatility expansion
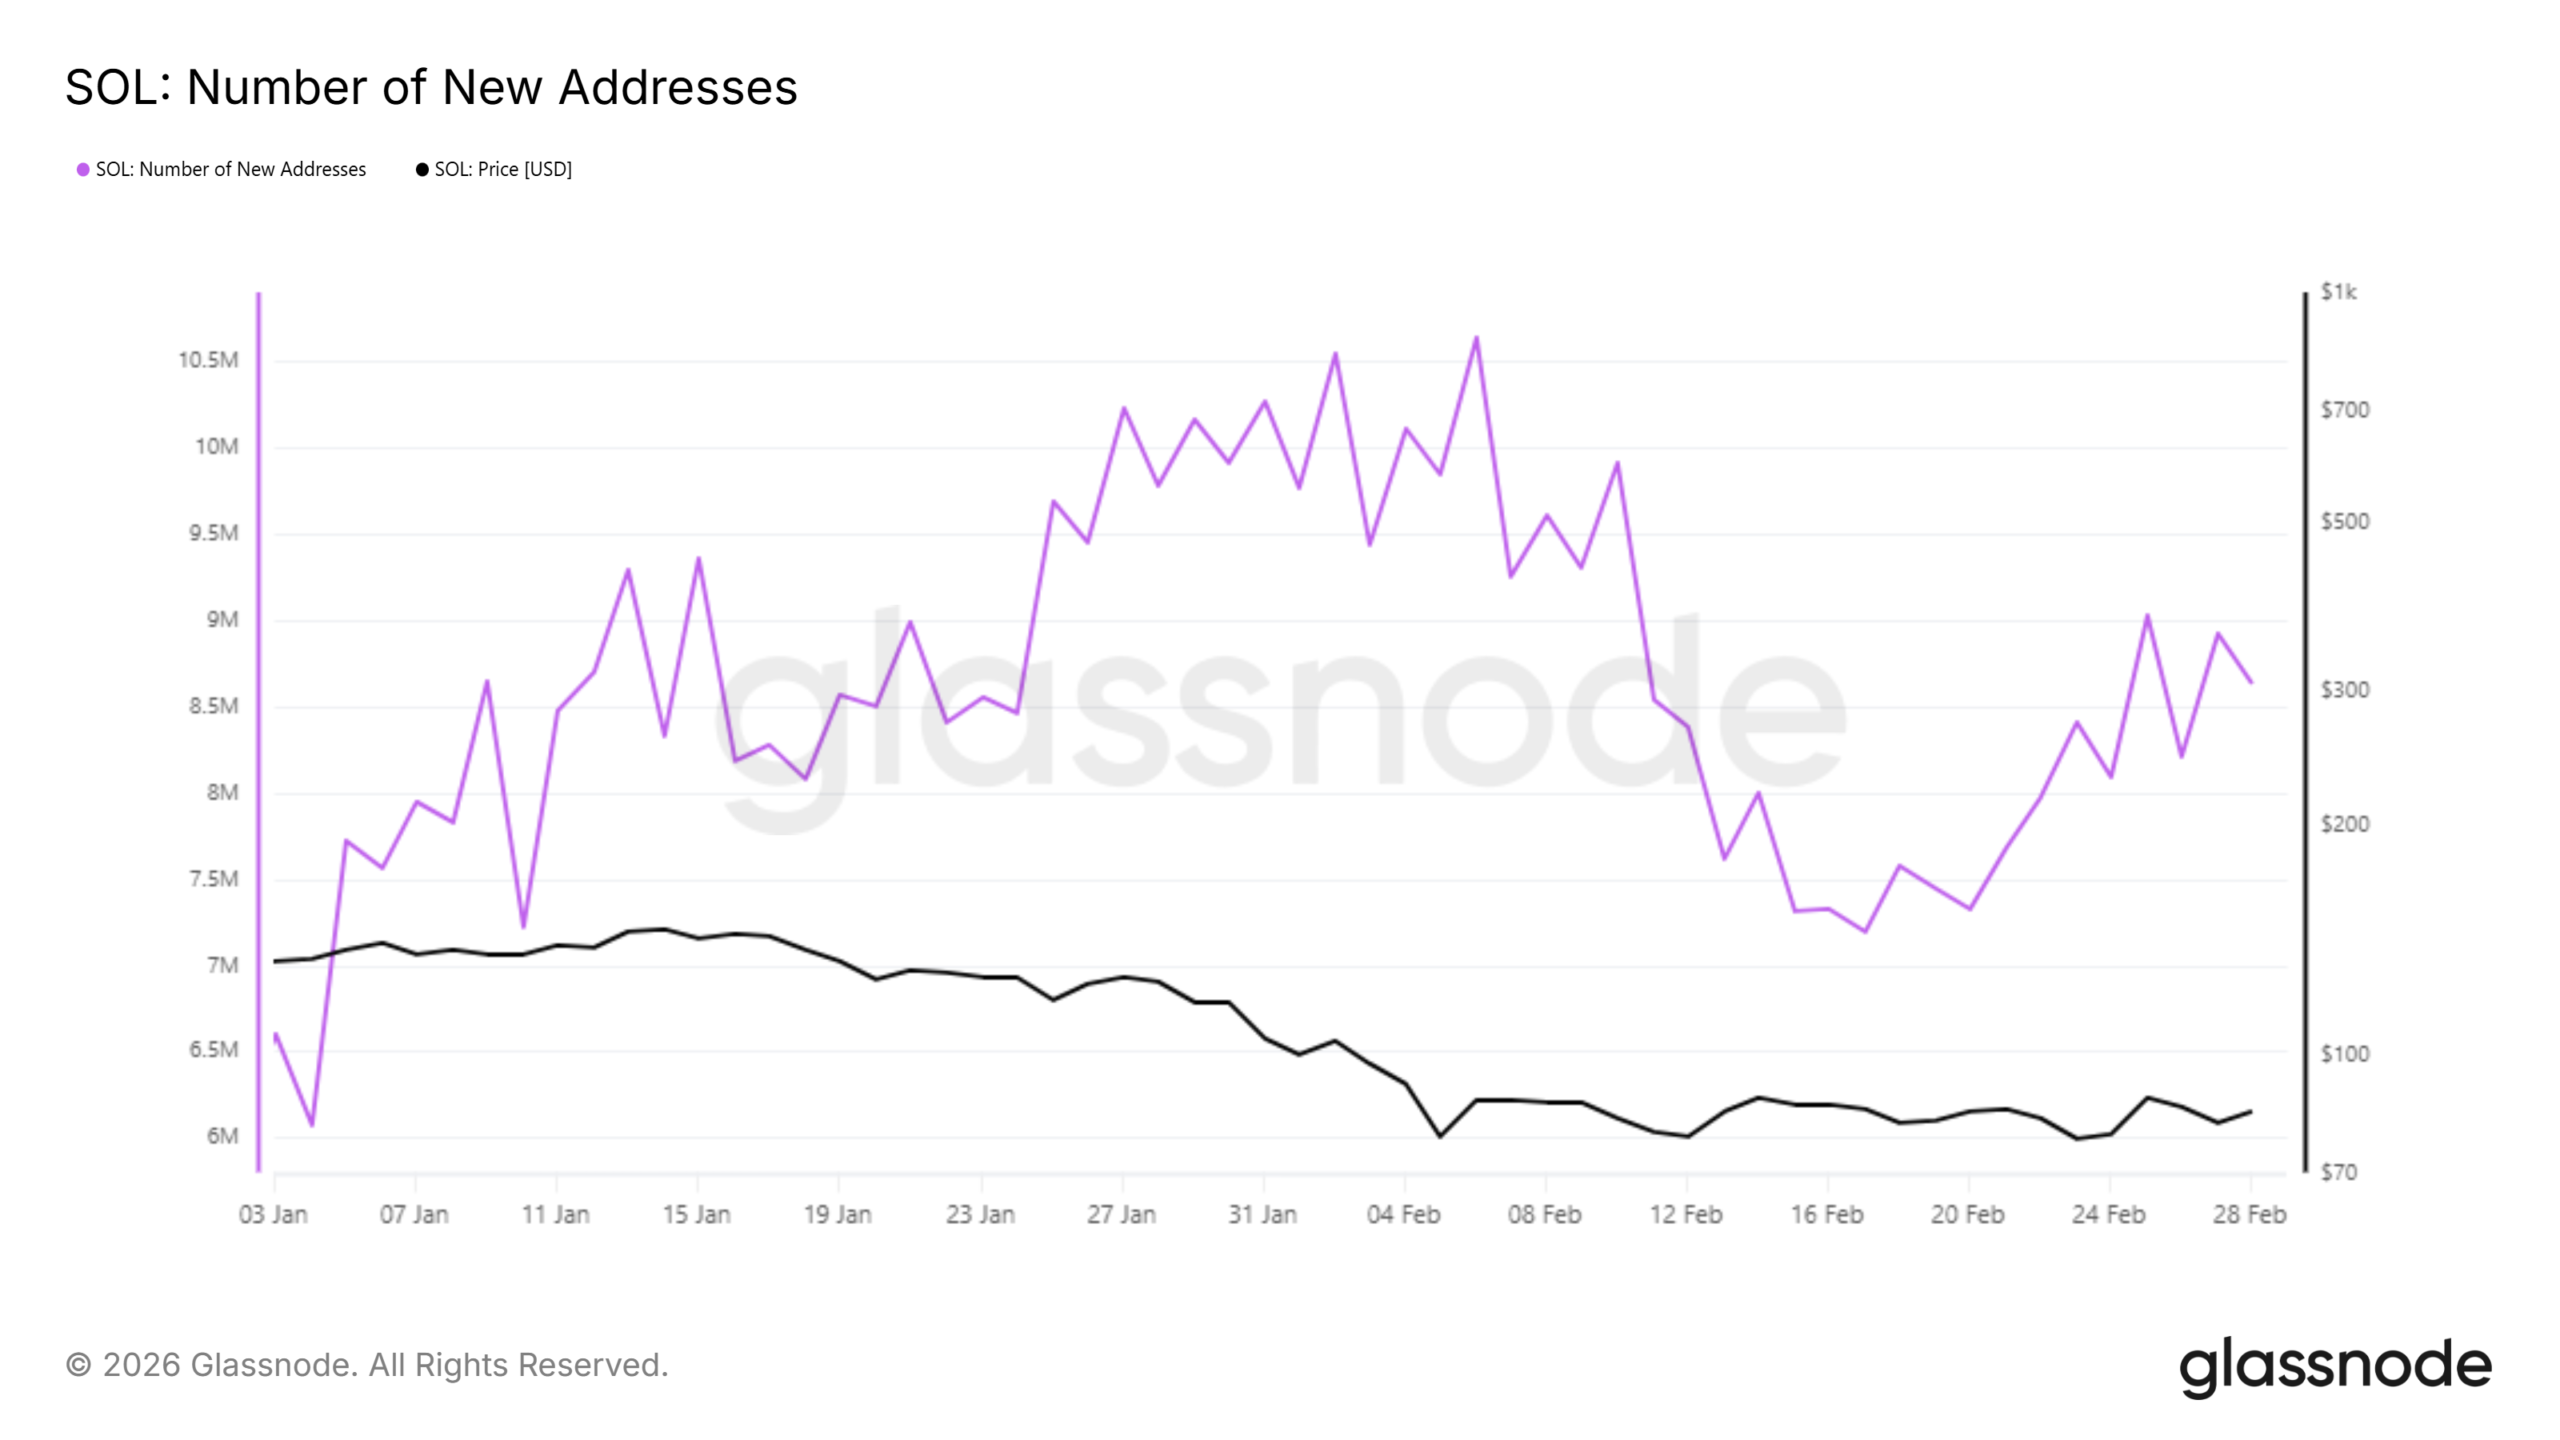
- Network metrics reveal 1.4 million additional daily new Solana addresses over 12 days, with the total climbing to 8.6 million
Solana (SOL) maintains its position around the $84–$85 level as of March 2, 2026, continuing a consolidation pattern that has persisted for nearly a month. The digital asset has repeatedly tested the boundaries between $77 and $88 without establishing a clear directional bias.

While price movement remains muted, institutional capital continues flowing into the ecosystem. Spot Solana exchange-traded funds in the United States captured $44.44 million in weekly inflows during the previous week, featuring a standout single-day intake of $30.86 million on Wednesday.
Year-to-date cumulative ETF inflows have now crossed the $900 million threshold. February witnessed an impressive streak exceeding 12 consecutive days of net positive flows, occurring simultaneously with outflows from Bitcoin and Ethereum ETF products.

Retail trader behavior presents a contrasting picture. Futures Open Interest for SOL contracted by over 6% within a 24-hour period, settling at $4.89 billion as traders unwound existing positions.
Liquidation data shows $26.47 million in forced position closures during this timeframe, with $20.47 million stemming from long contracts. This concentration indicates a substantial elimination of bullish leveraged bets.
Despite widespread liquidations, funding rates remain elevated at 0.0037–0.0041%, indicating leveraged traders continue paying premiums to maintain long exposure.
Key Technical Levels
SOL currently trades beneath both its 50-day and 200-day Exponential Moving Averages, positioned at $99.06 and $137.23 respectively. These moving averages continue functioning as significant resistance barriers.
The Relative Strength Index registers approximately 43, positioned below the 50 neutral threshold. The MACD histogram displays diminishing bearish pressure without confirming a bullish reversal signal.
Bollinger Bands exhibit notable convergence on daily timeframes. Such compression patterns frequently precede substantial price movements, although directional bias remains unconfirmed.
Analyst Umair Crypto highlighted divergent behavior between SOL’s USDT and BTC trading pairs. The USDT chart displays declining highs, whereas the BTC pair demonstrates ascending highs — a divergence persisting for 24 days.
On-Chain Data Shows Network Growth
Blockchain analytics from Glassnode indicate daily new Solana addresses increased by 1.4 million throughout the preceding 12 days, elevating the cumulative total to 8.6 million. This metric points toward expanding user participation across the network.
Long-term holders maintain profitable positions overall, although accumulation velocity has moderated. Hodler net position change metrics demonstrate sustained commitment with tempered acquisition momentum.
A successful breach above $88 followed by $93.43 would establish the 50-day EMA near $99 as the subsequent objective. Sustained trading above this level creates opportunity for advancement toward $137.
Alternatively, a breakdown beneath $77 would expose the February 6 low at $67.50 as the next significant support zone.
Trading volume for SOL decreased 5.77% to $12.20 billion, while Open Interest similarly contracted 3.73% to $4.88 billion according to current market data.