
TLDR
- Crypto Patel identifies a confirmed bull flag breakout pattern on BNB’s higher timeframe charts, establishing a long-term objective of $5,000.
- Following the breakout, the $600–$700 range has emerged as critical support territory.
- Additional support levels appear in the mid-$500s, while a more substantial accumulation area exists around the low $400s.
- Technical indicators show RSI at 59, a bullish MACD configuration, and several EMAs clustering near $623, suggesting sustained upward momentum.
- Achievement of the $5,000 projection relies on ecosystem expansion, exchange market position, and overall cryptocurrency market dynamics.
Binance Coin has captured market attention following crypto analyst Crypto Patel’s identification of a bull flag breakout on the weekly timeframe, establishing a long-term objective of $5,000.
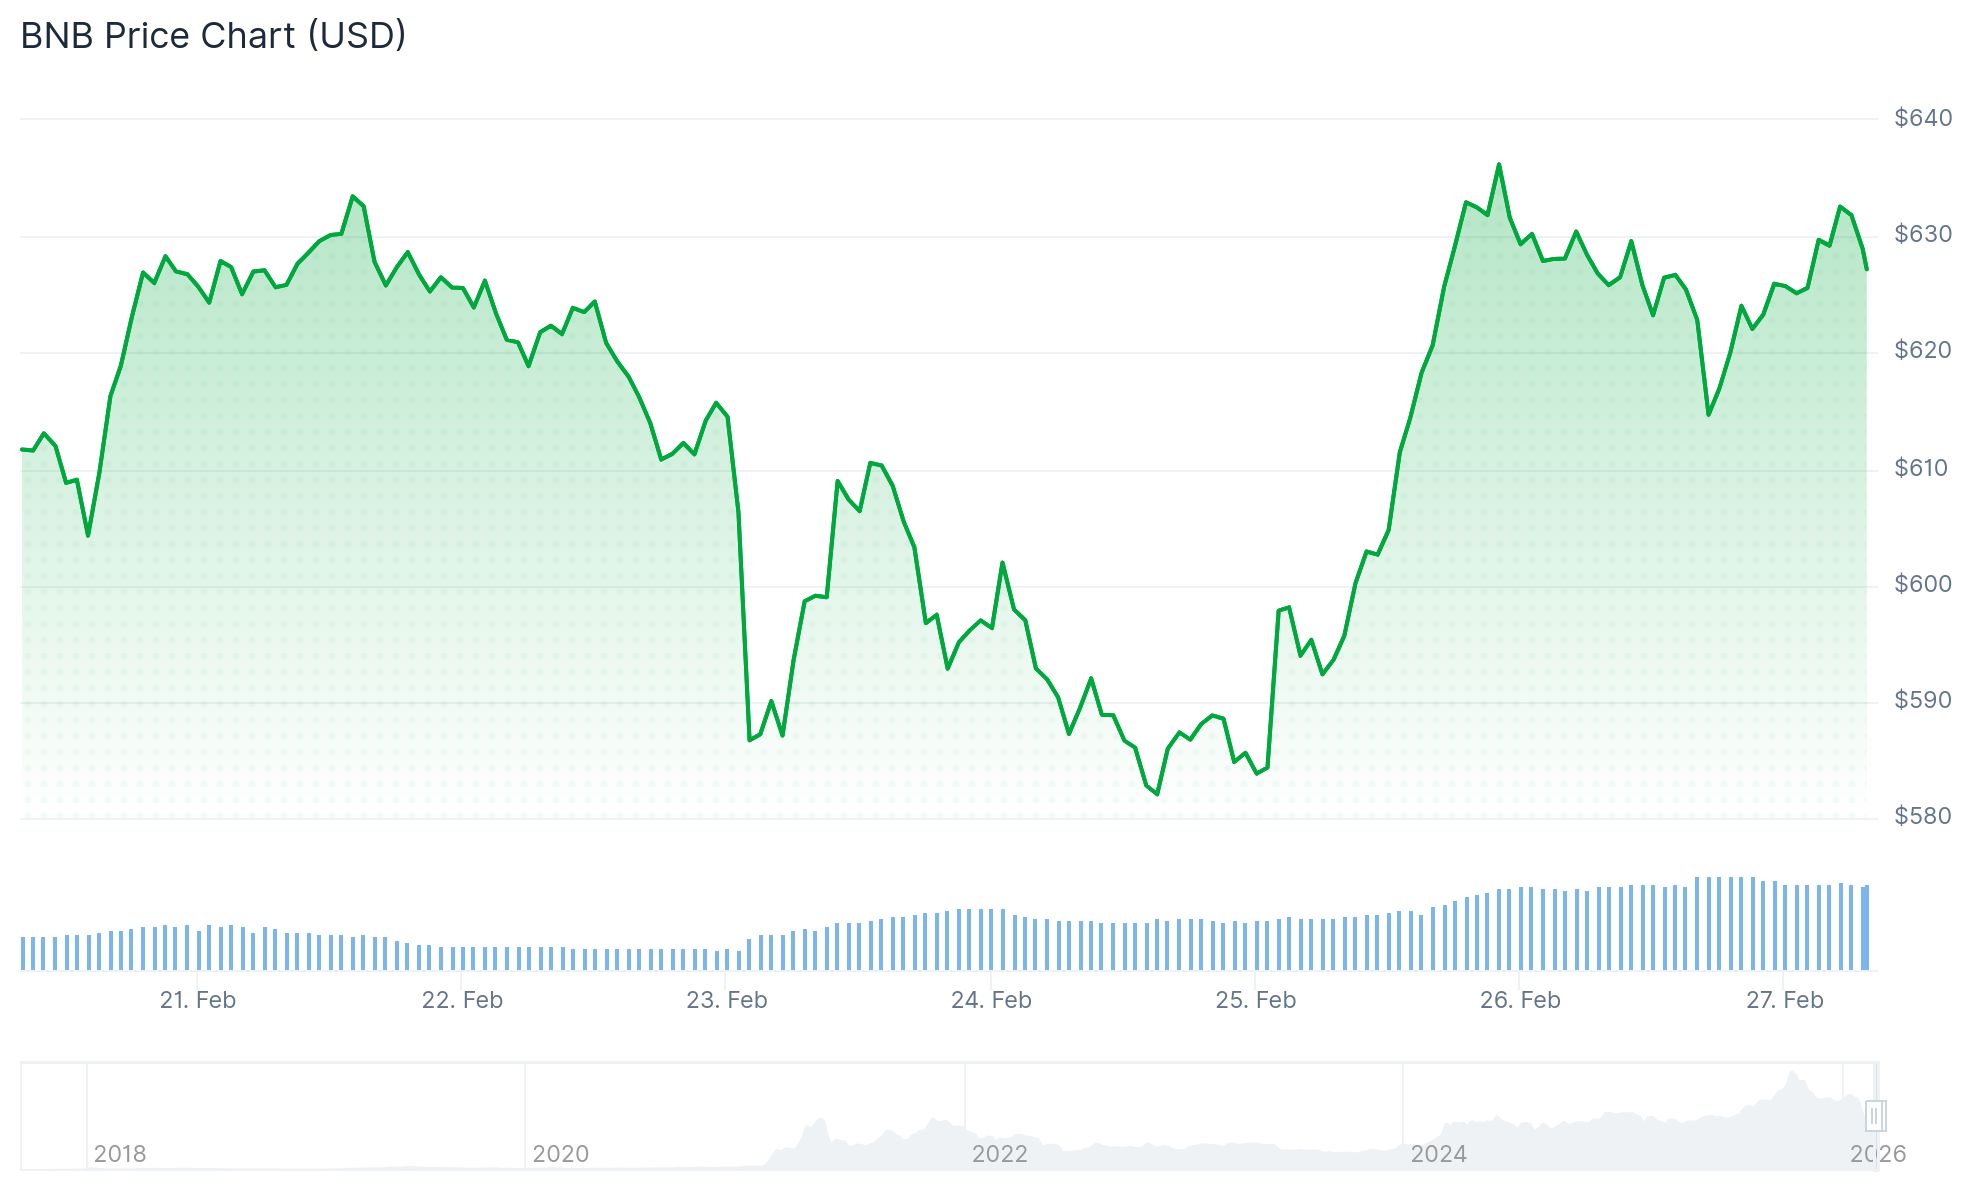
As of February 26, BNB was changing hands around $623, following a brief probe of $640 before retracing.
This technical pattern emerges when an asset experiences a sharp upward movement followed by sideways consolidation. Technical analysts view a breakout above this consolidation phase as confirmation that the uptrend may resume.
Patel presented a weekly chart displaying BNB’s movement beyond a prolonged compression area that developed after its prior cycle peak. He interprets the advance above this zone as pattern confirmation.
Market participants now monitor the $600–$700 band as critical support territory. The bullish scenario remains viable while BNB maintains trading activity above this zone, according to the technical assessment.
Support Levels to Watch
Below the current trading range, a support zone emerges in the mid-$500s. Should a more significant retracement occur, BNB could find itself at a “best accumulation zone” positioned near the low $400s, based on Patel’s chart analysis.
Invalidation of the bullish framework would require a long-term structural breakdown, which currently remains absent from higher timeframe chart analysis.
What the Indicators Show
TradingView data reveals multiple EMAs — the 20, 50, 100, and 200-period averages — clustering around $623, establishing this level as a pivotal short-term support and resistance zone.
The Ichimoku Cloud displays price action slightly above the cloud formation, indicating cautious bullish momentum. The Kijun and Tenkan lines rest beneath current price levels, offering support within the $615–$623 band.
RSI readings stand at 59, positioned above the neutral 50 mark, reflecting moderate bullish momentum. The RSI’s moving average displays an upward trajectory.
The MACD line trades above its signal line, with both positioned in positive territory. The histogram shows positive expansion, demonstrating current buyer dominance in the market.
A sustained close above $623 may facilitate movement toward the $630–$635 range. Conversely, a decline beneath $615 and the cloud structure could direct price action toward the $608–$610 zone.
The $5,000 objective represents a long-term forecast connected to ecosystem development, exchange market leadership, and broader cryptocurrency market conditions — rather than a near-term trading scenario.
As of February 27, BNB maintains its position above the $620 threshold with technical indicators reinforcing the present bullish outlook.
Remember: Preserve all tokens like [[EMBED_0]], [[IMG_0]], [[LINK_START_0]], [[LINK_END_0]], [[SCRIPT_0]], [[FIGURE_0]] etc. exactly as they appear. These are placeholders for embeds, images, and links that must not be changed.