 Slides 5% Following Tehran Strikes—Critical Support Zones in Focus")
TLDR
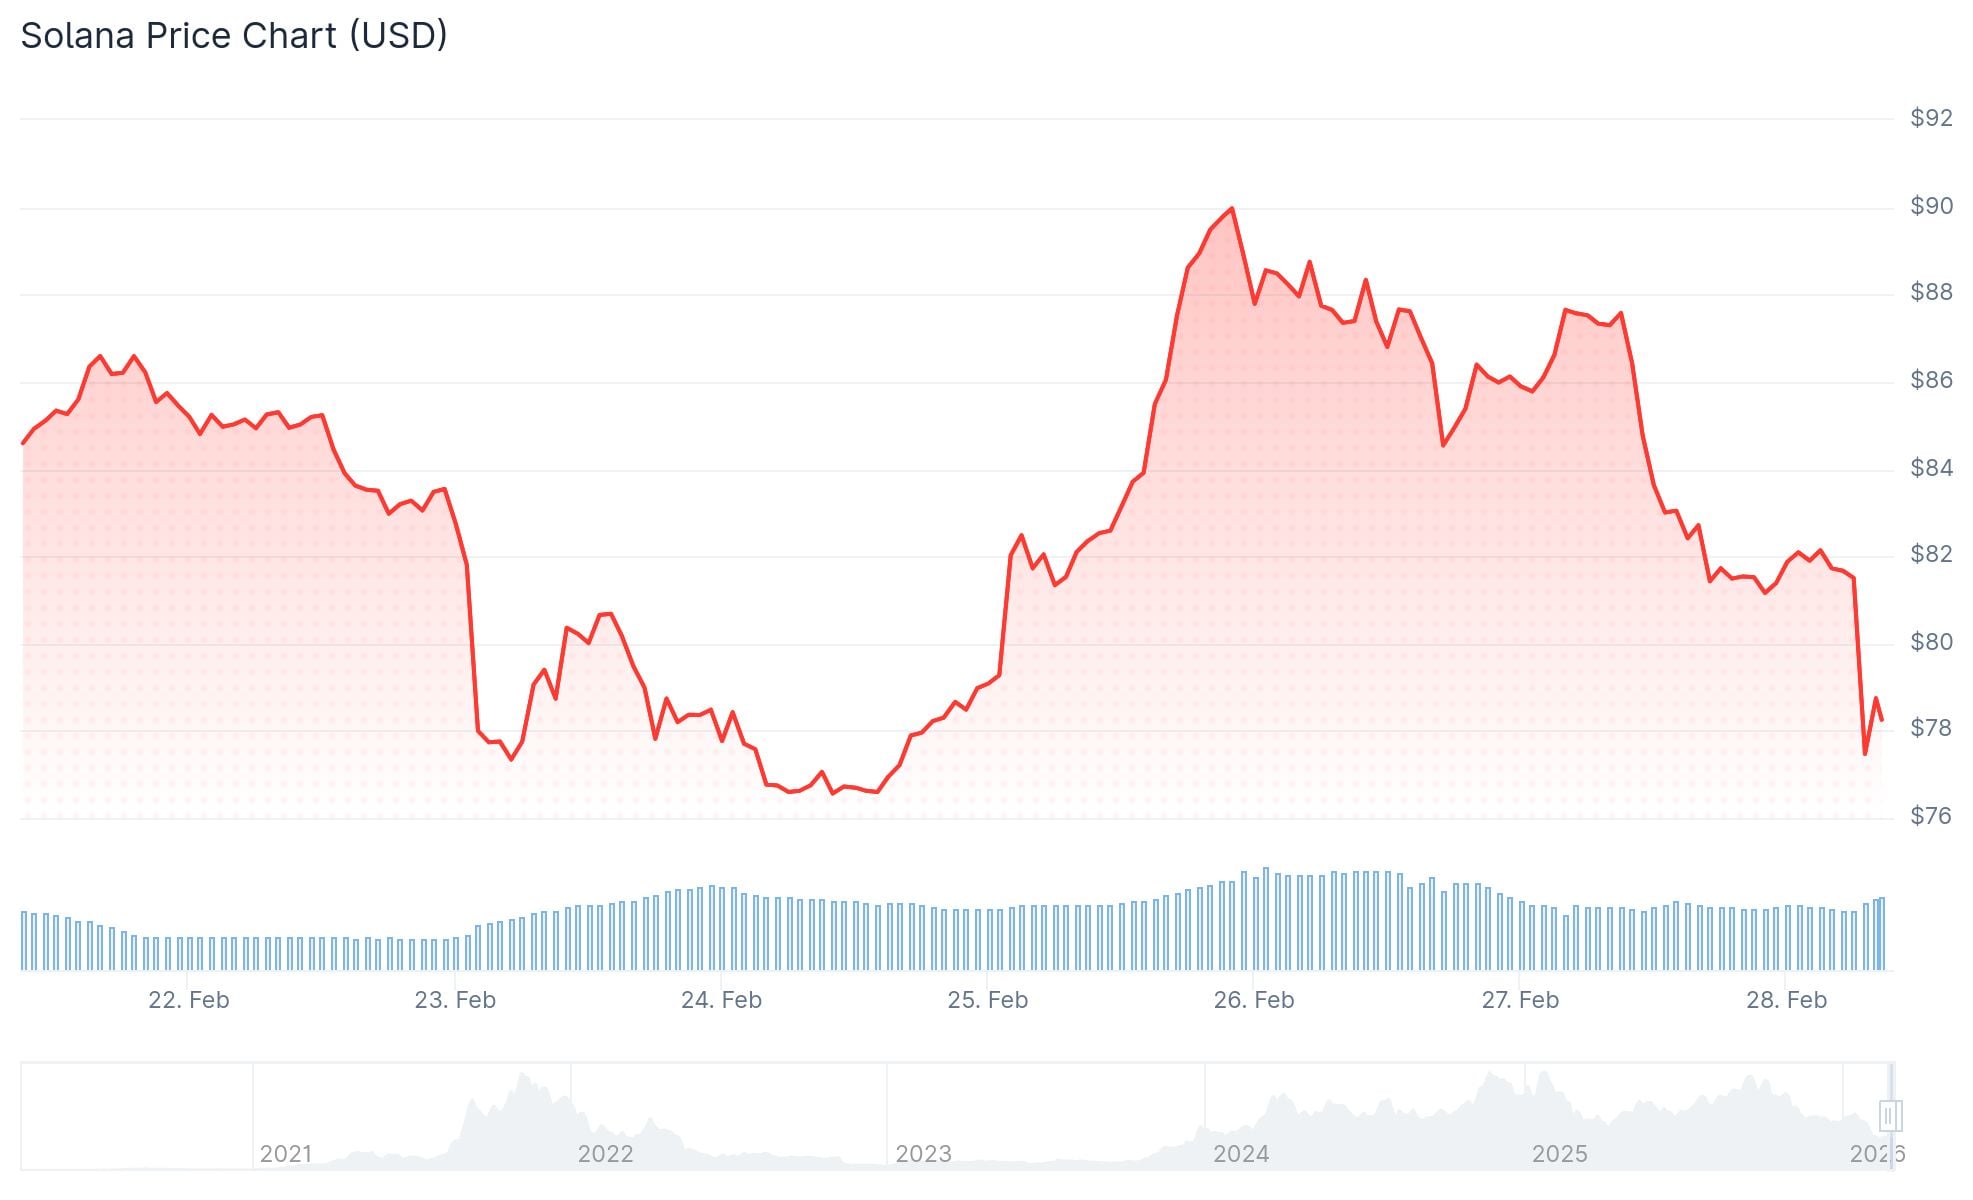
- SOL currently trades around $78, representing a 72% decline from its $295 all-time high
- Spot SOL ETF products recorded only $11.3M in outflows while Bitcoin and Ethereum ETFs experienced four straight months of negative flows
- Solana captured $108 billion in DEX trading volume over 30 days, surpassing Ethereum’s $63.7 billion
- Analysts identify critical support zones at $50, $22, and $10 using Parallel Channel analysis
- Military action between Israel and Iran sparked widespread crypto liquidations, driving Bitcoin near $60,000 and weighing on altcoins including SOL
Solana’s native token SOL sits at $78, marking a 72% retreat from its $295 peak. The decline intensified during a market-wide crypto downturn, with geopolitical developments adding pressure on February 28, 2026.
Israel executed a military strike targeting Iran on Saturday morning local time. The United States joined the operation, according to sources cited by AP. Bitcoin plunged nearly 5% within minutes, approaching $60,000, while the selloff rippled through altcoins including SOL.
Solana’s on-chain metrics continue showing resilience despite price weakness. The network handled $108 billion in decentralized exchange volume during the past 30 days, outpacing Ethereum’s $63.7 billion and Base’s $31.48 billion.
During the previous 24-hour period, Solana applications generated $3.1 million in revenue compared to Ethereum’s $2.95 million. Solana registered 2.17 million active addresses against Ethereum’s 682,236.
Solana’s real-world asset sector achieved a record $1.71 billion valuation, climbing 45% over 30 days.
SOL ETF Flows Demonstrate Resilience
Spot SOL exchange-traded funds debuted in late October 2025, attracting over $100 million in average net inflows throughout their initial five weeks. Weekly inflows have moderated to $20–$25 million as prices declined.
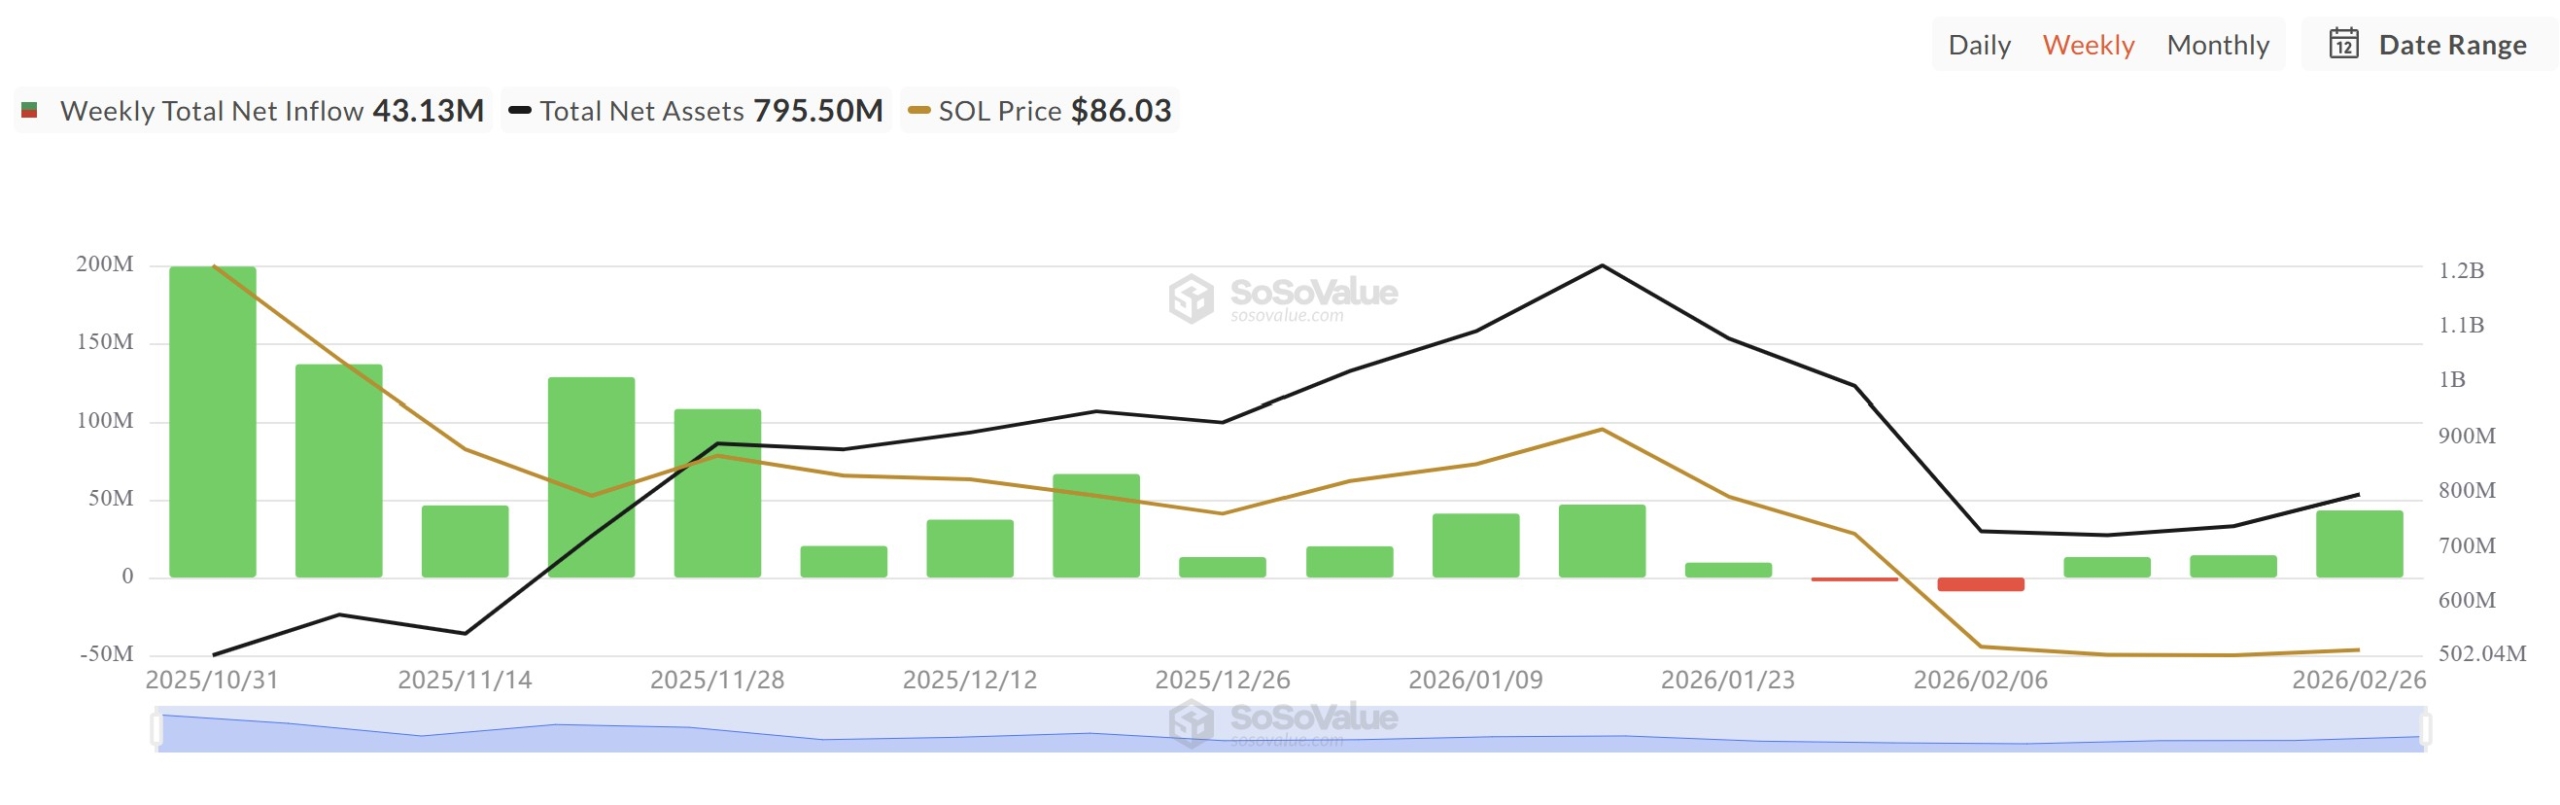
Total cumulative outflows during the four-month correction period amount to just $11.3 million spread across two weeks. Bitcoin and Ethereum ETF products experienced four consecutive months of negative flows during the same timeframe.
Solana currently trades significantly below the $188 price point recorded when its ETF products launched.
Critical Support Zones Under Surveillance
Analyst Ali Martinez highlighted a Parallel Channel formation appearing on SOL’s weekly timeframe. This technical pattern suggests support zones at $50.22, $22.47, and $9.98.
Analyst Crypto Scient pinpointed two supplementary regions. The primary zone corresponds to the 0.75 Fibonacci retracement level spanning $60 to $70. The secondary area represents a weekly demand fair value gap ranging from $22 to $29.
Glassnode UTXO data reveals over 6% of SOL supply last transacted within the present price range. The following significant supply concentration, exceeding 3%, occupies the $20 to $30 band.
SOL remains below the weekly resistance threshold of $120. The $51 to $80 range on weekly charts has undergone testing and corresponds with the retracement area under analyst scrutiny.
As of February 28, 2026, SOL traded at $78 while markets processed developments from the Israel-Iran military engagement.