 Rebounds From $75 Low as Fibonacci Support Holds and BSOL ETF Draws Capital")
TLDR
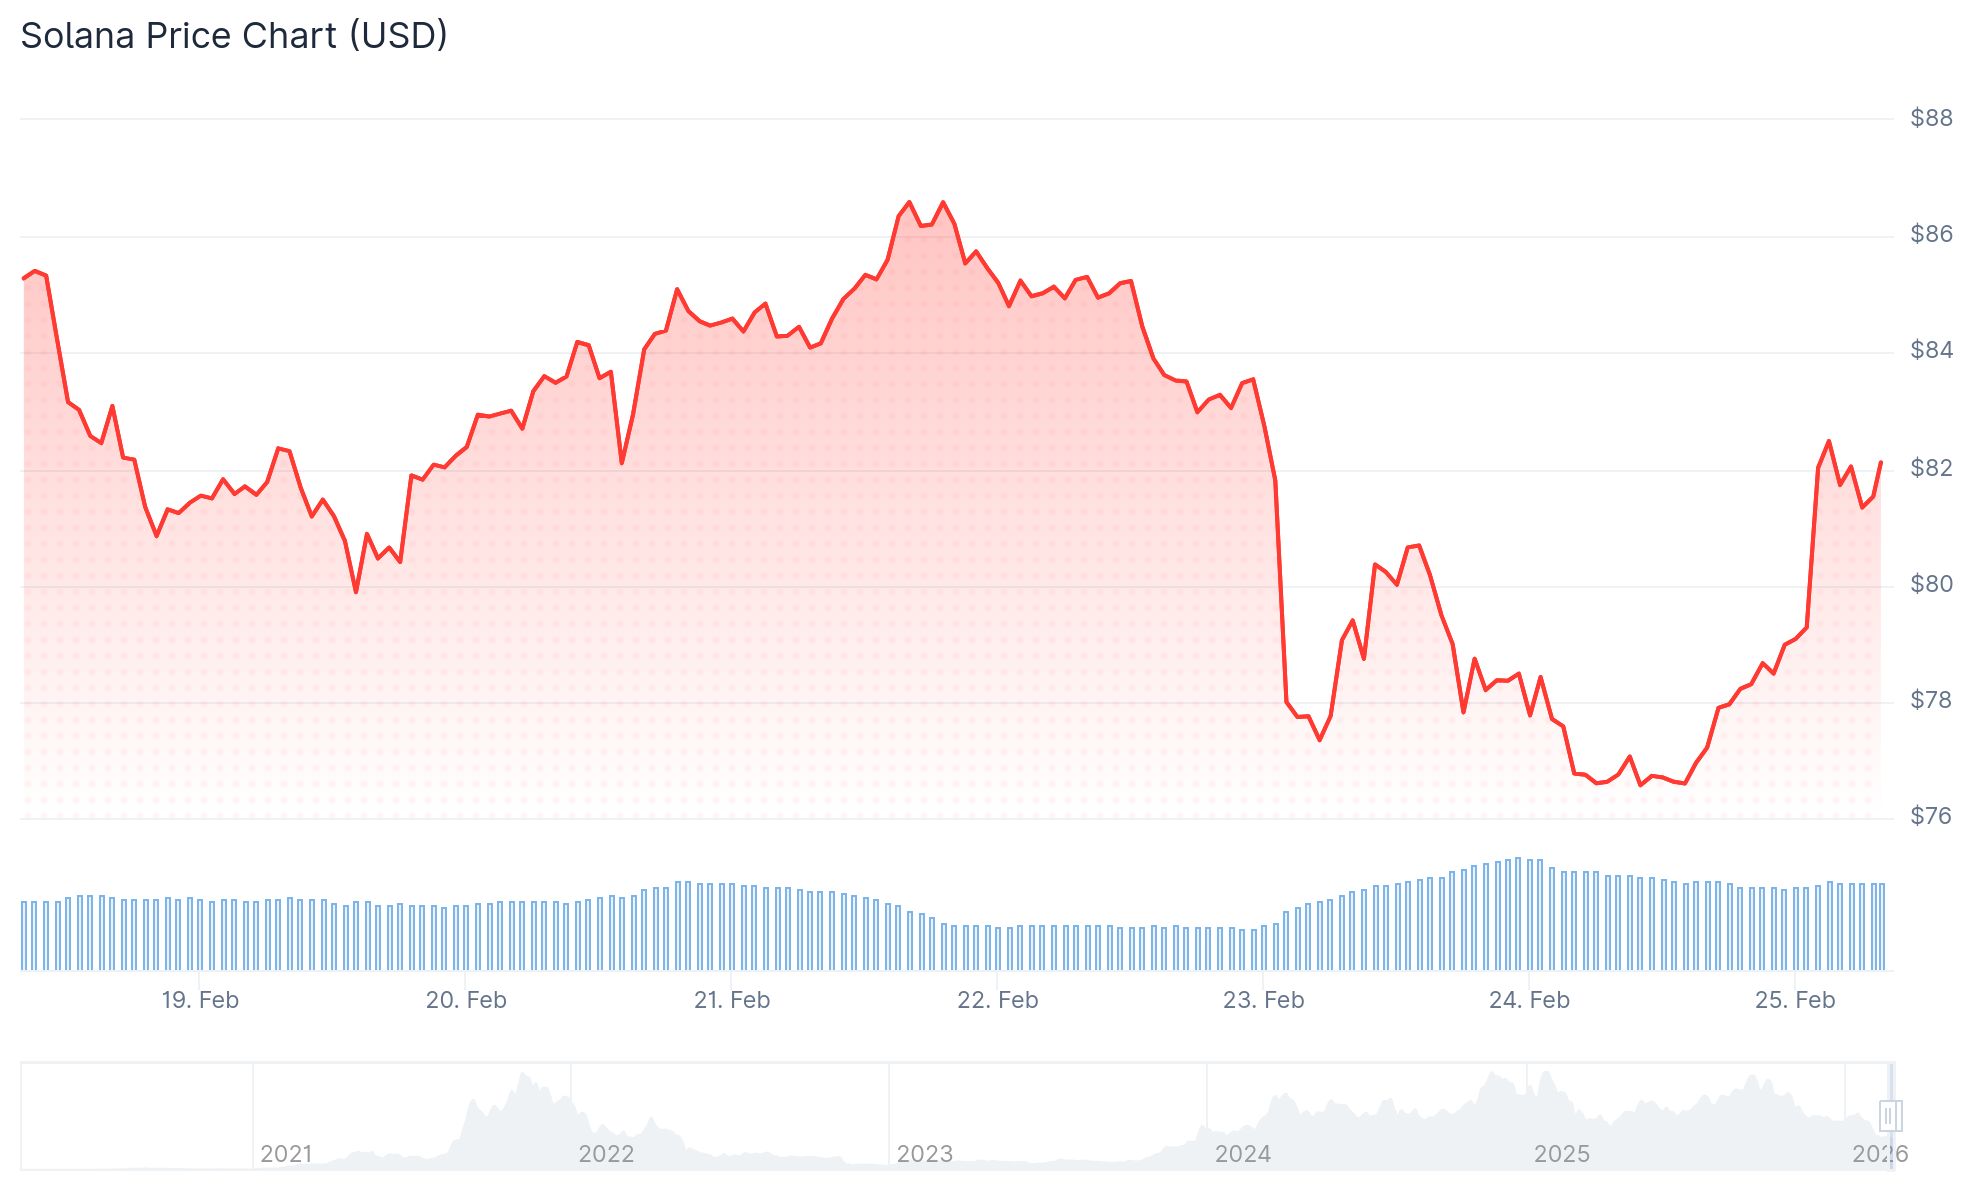
- SOL has climbed back to $80 territory following a pullback that reached $75.64
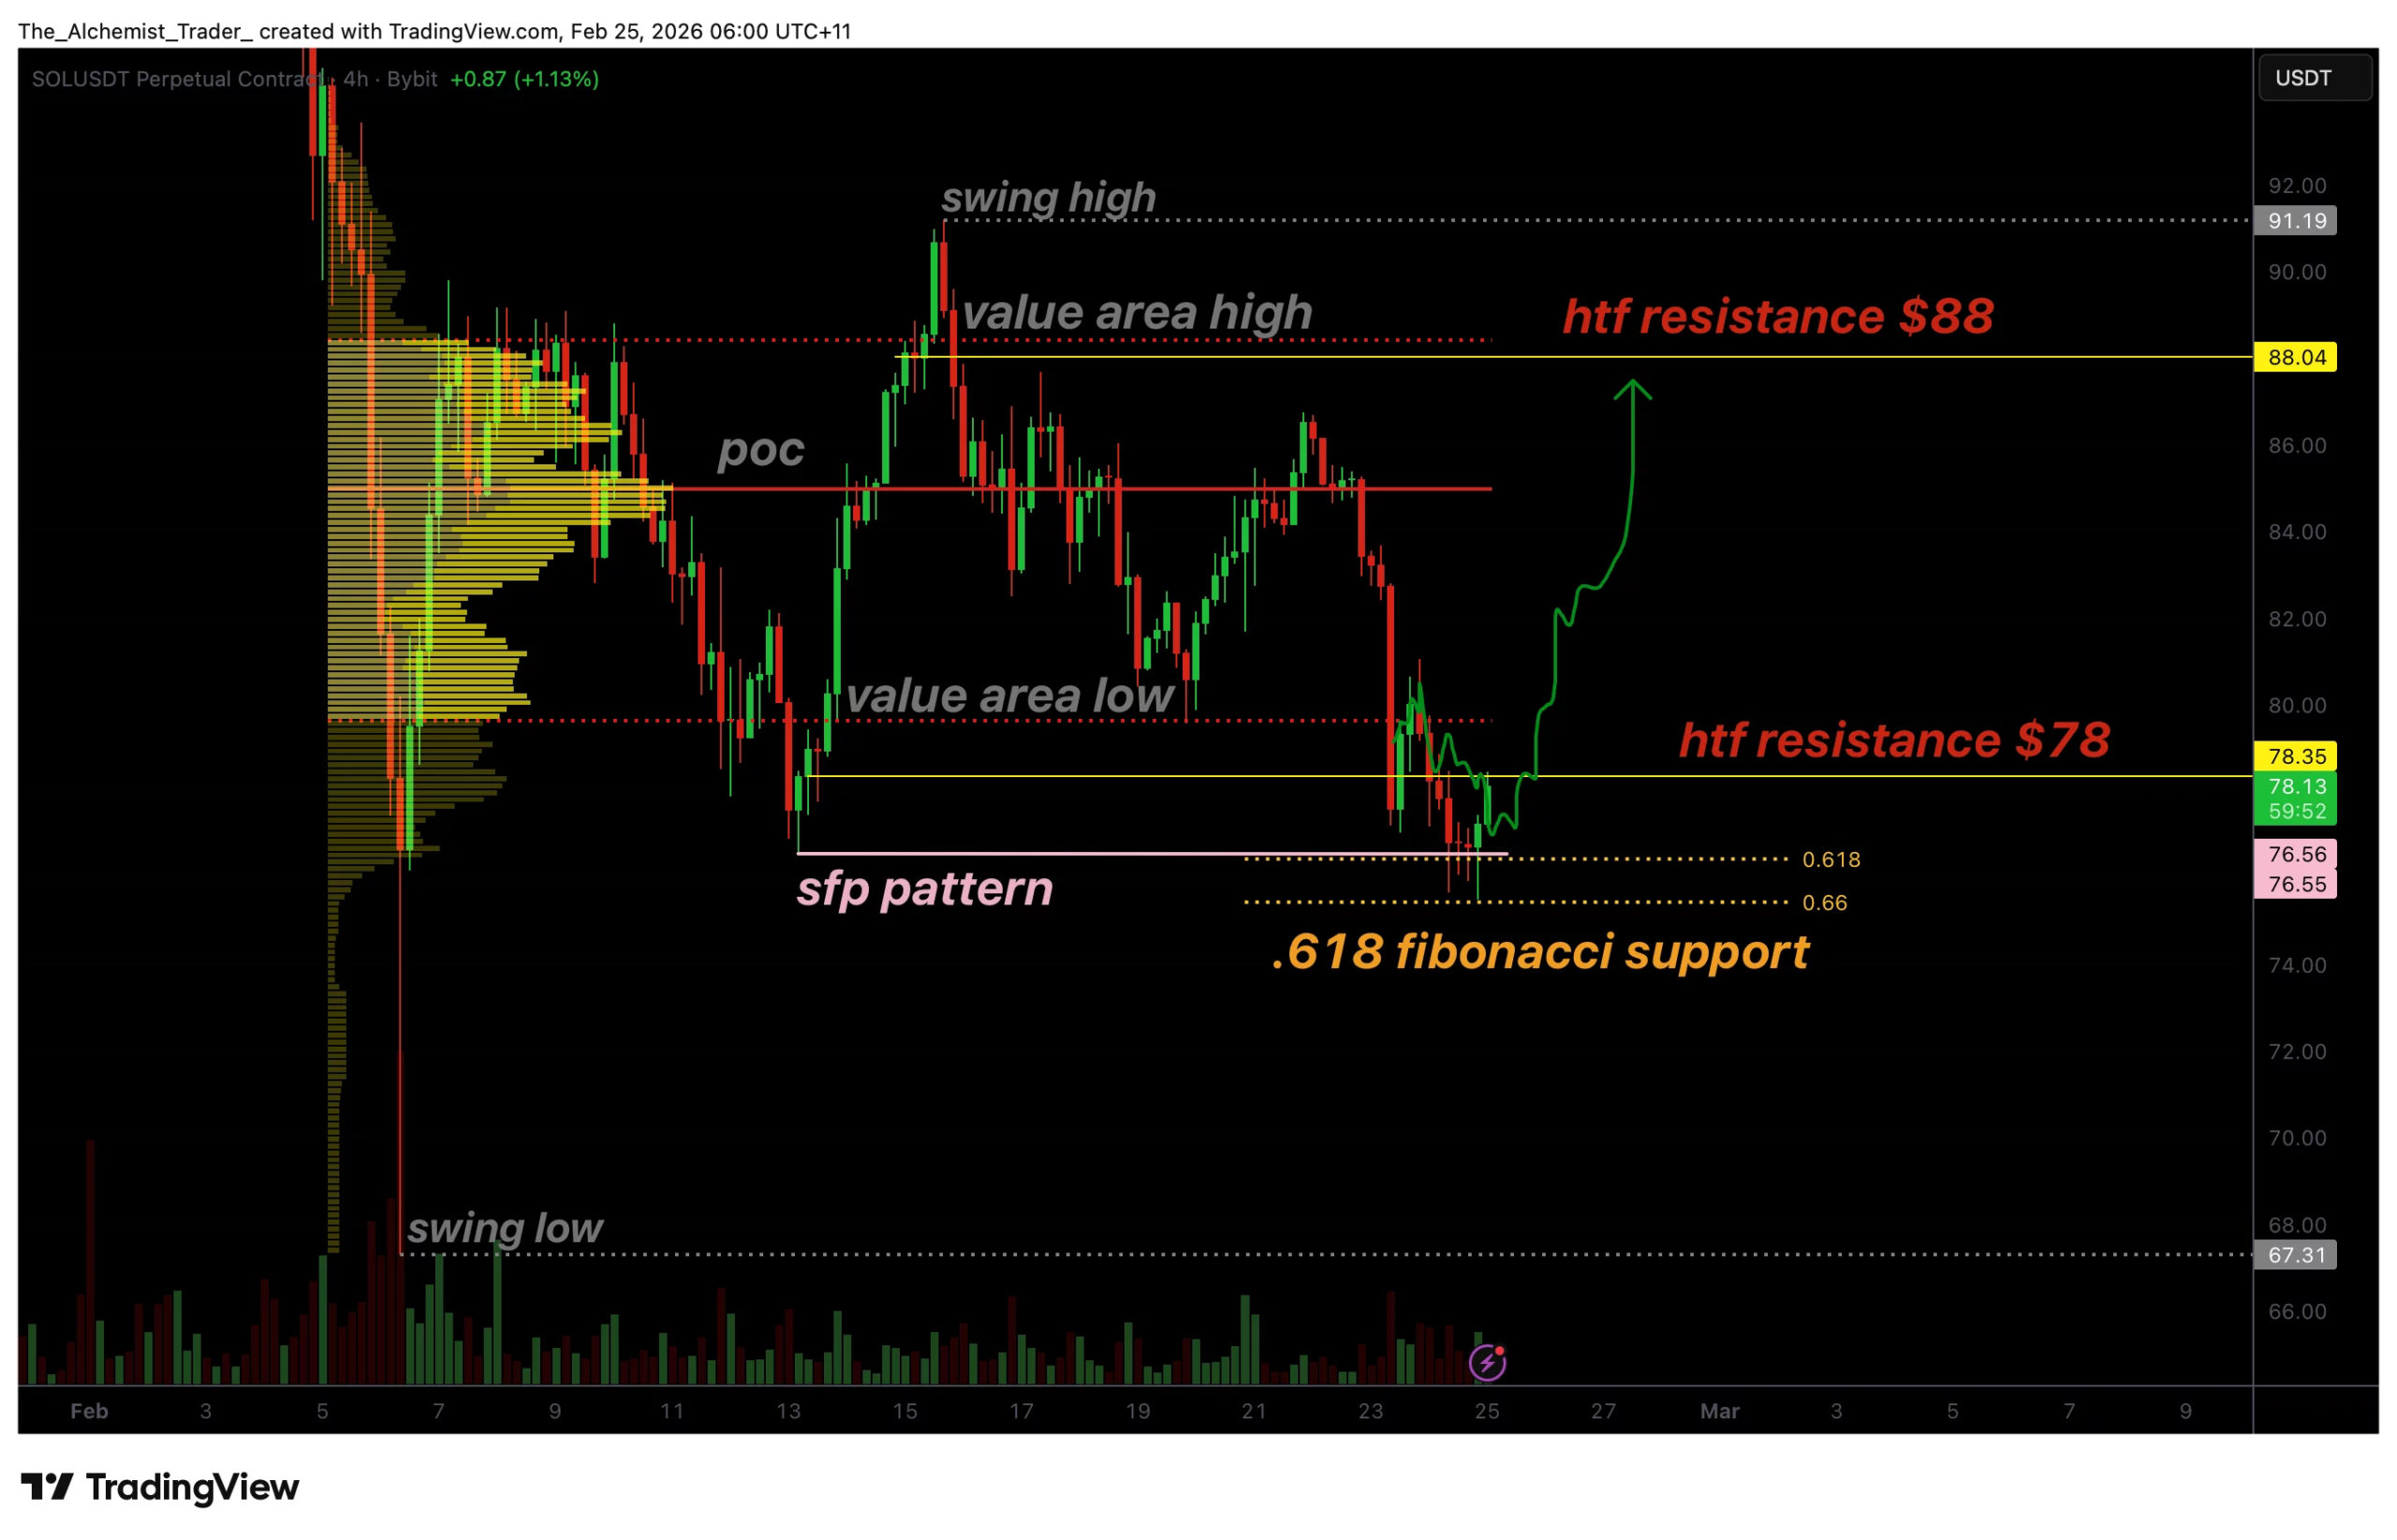
- Technical analysis reveals a swing failure pattern (SFP) developing at the 0.618 Fibonacci support zone, indicating possible near-term reversal
- Price faces resistance hurdles at $82, $84, and $85, with potential extension toward $92 and $95
- Maintaining support above the $78–$82 range remains essential for validating any constructive price structure
- BSOL staking ETF from Bitwise recorded more than $3 million in net inflows on February 23, despite SOL experiencing a ~41% decline over the past three months
Solana has initiated a rebound following its decline to $75.64. The cryptocurrency has regained ground above the $80 threshold and currently trades above its 100-hourly simple moving average.
This recovery emerged after SOL breached a descending trend line that had capped rallies at $81 on the hourly timeframe.
The token also surpassed the 50% Fibonacci retracement level calculated from the swing high of $86.68 down to the swing low of $75.64. This development offers a constructive signal for near-term momentum.
Resistance pressure remains evident near $82.50, which corresponds to the 61.8% Fibonacci retracement level. This area represents the immediate challenge for buyers attempting to push prices higher.
A swing failure pattern (SFP) has emerged at the 0.618 Fibonacci support zone. This technical formation occurs when price momentarily dips beneath a previous low, triggers stop-loss orders, then rapidly reverses upward.
Several downside wicks visible on the chart indicate that selling attempts failed to sustain lower prices. Buyers emerged to counteract the downward pressure.
Traders interpret this formation as a potential indication of local bottom formation, though additional confirmation remains necessary.
$78 Is the Key Level to Watch
For this recovery attempt to establish legitimacy, SOL must recapture and maintain support above $78. This price point serves as local resistance and represents a critical juncture for determining short-term trajectory.
Sustaining prices above $78 would also position SOL above the value area low, a metric employed in volume profile analysis to assess buyer engagement.
Successfully defending $78 would establish $88 as the subsequent upside objective. This target aligns with previous distribution zones and would mark a substantial recovery from current price levels.
Beyond that point, resistance zones exist at $92 followed by $95. However, clearing $85 would be prerequisite for accessing those higher targets.
BSOL ETF Sees Inflows Despite Price Drop
Regarding institutional activity, Bitwise’s Solana Staking ETF (BSOL) attracted $3,048,570 in net inflows on February 23, 2026.
This brings the fund’s cumulative assets under management to $490,255,220. The single-day inflow represents approximately 0.62% of total AUM.
This capital injection occurred while SOL had declined roughly 41% across the preceding three-month period. Technical indicators for SOL-USD were displaying a Strong Sell signal during this timeframe.
Should SOL fail to overcome the $82 barrier, immediate downside support exists at $80, followed by $79. Breaking beneath $79 could direct price action back toward $77 or potentially $74.
SOL was changing hands at $76.57 when the BSOL inflow data was reported on February 23.