
TLDR
- XRP currently hovers near $1.39, experiencing a 15.6% decline throughout February 2026, positioned beneath its 50-day and 200-day EMAs.
- Market analysts identify three technical indicators that preceded November 2024’s major rally — exchange inflow surges, contracting USD liquidity, and declining XRP availability — now reappearing in current market conditions.
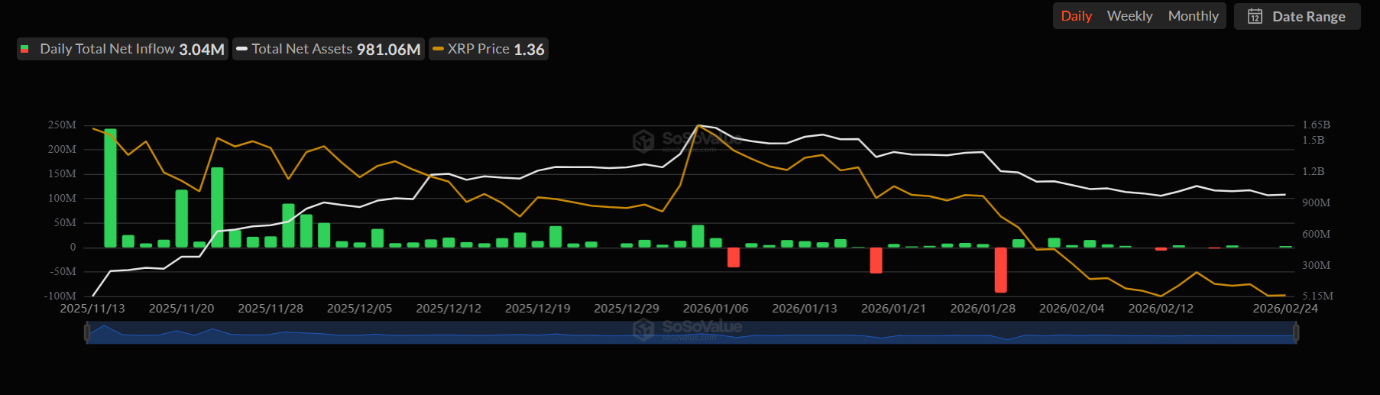
- Spot XRP ETFs accumulated $3.04M in fresh capital on February 24, pushing cumulative net inflows to $1.23B since their debut.
- Federal Reserve rate cut probability for June decreased to 49.6% following robust consumer confidence readings, creating headwinds for cryptocurrency markets.
- Price projections from market observers range from $2.00 for medium-term scenarios to $10 if historical breakout patterns from 2024 materialize again.
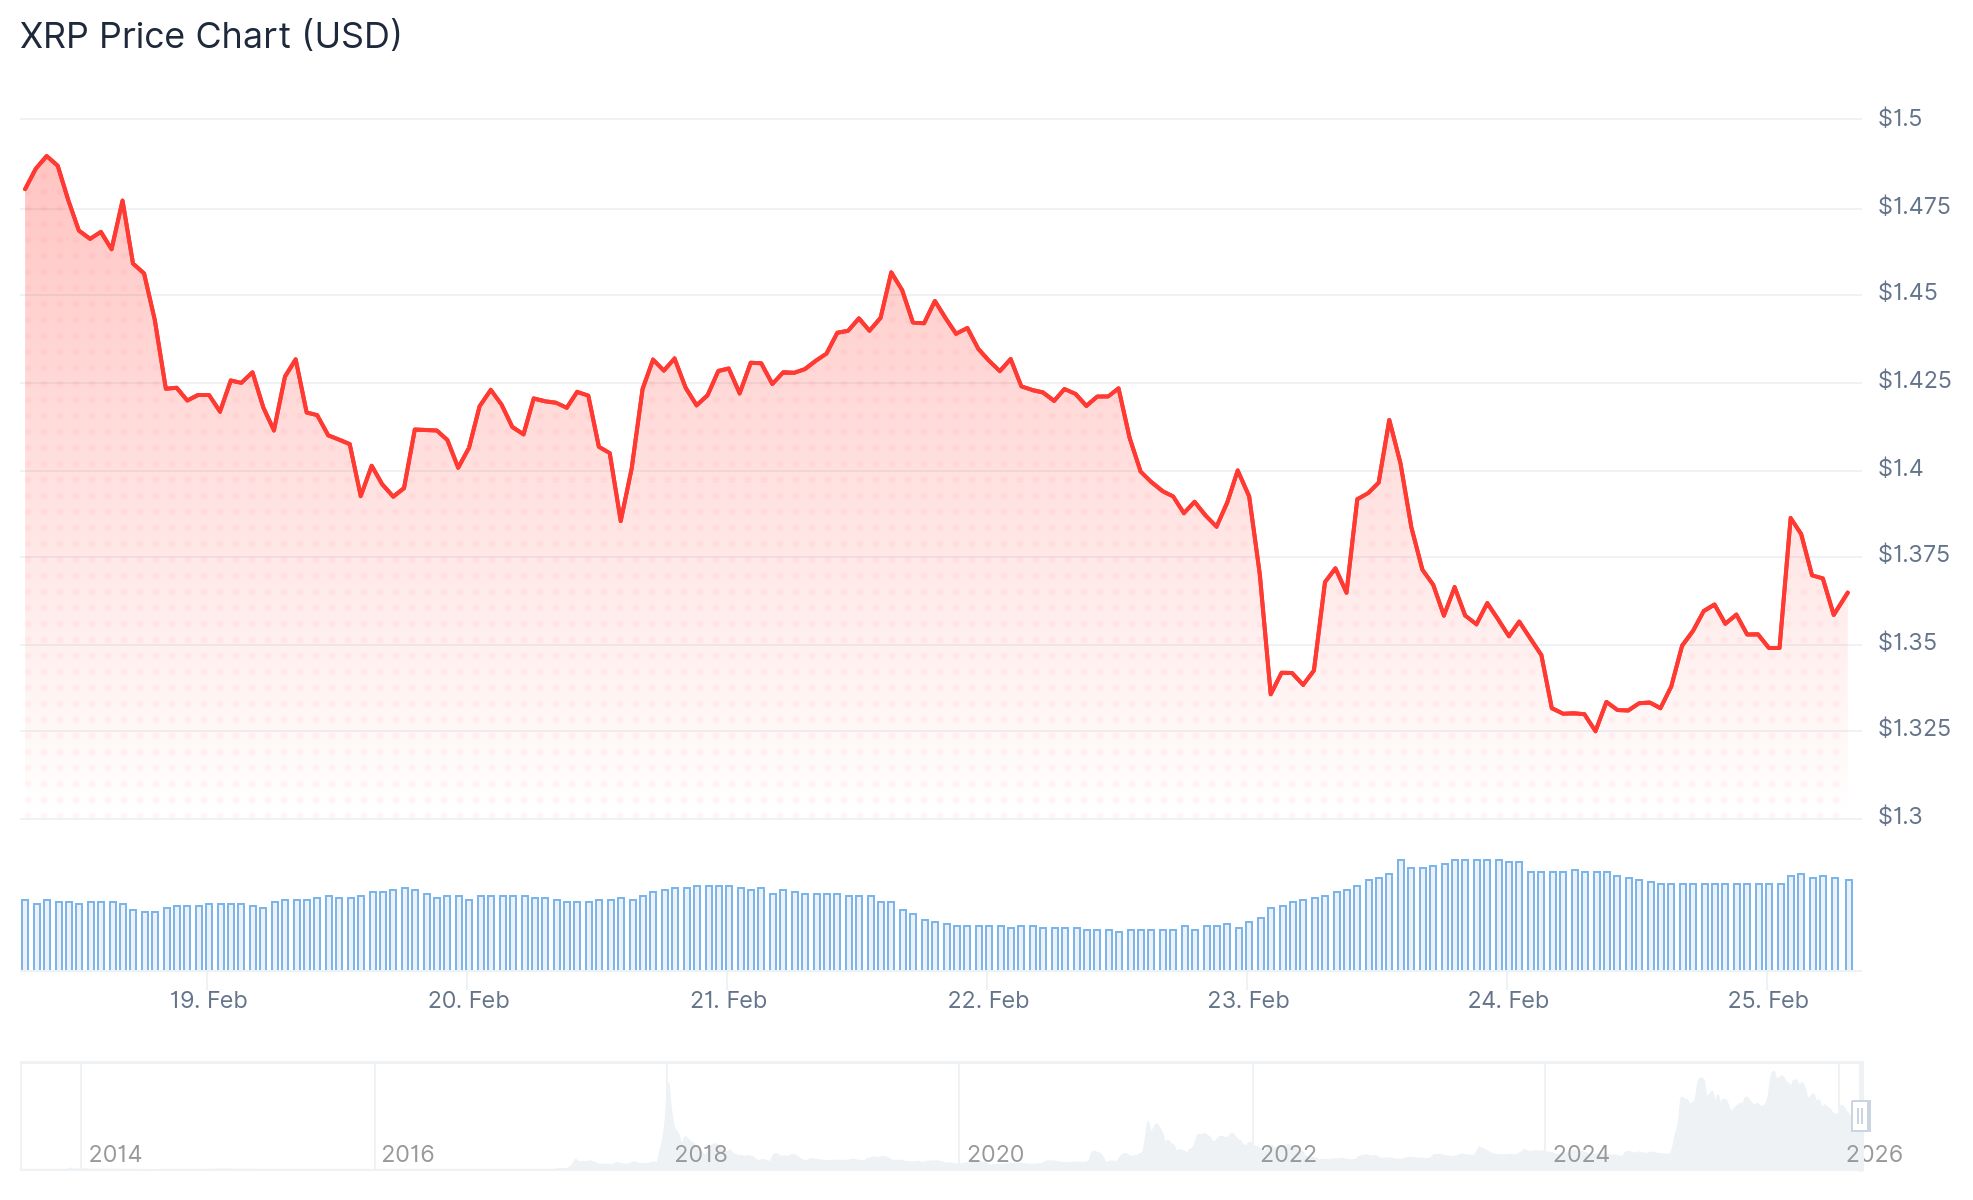
XRP maintains a trading position around $1.39 during late February 2026, reflecting a 15.6% monthly decline. The digital asset currently trades beneath both its 50-day and 200-day exponential moving averages, suggesting bearish momentum in the near term.
Despite downward price action, market observers are tracking three technical signals that emerged immediately before XRP’s substantial advance in late 2024.
During November 2024, XRP accelerated from $0.50 to reach $3.40 by January 2025 following Donald Trump’s victory in the U.S. presidential election. That price movement represented one of the most dramatic rallies in the asset’s trading history.
CryptoQuant data analyzed by market researcher Xaif indicates the same three technical signals are developing again during February 2026.
The first indicator involves elevated exchange inflows on Binance. Prior to the 2024 rally, substantial XRP transfers to the exchange occurred — including 15.12 billion XRP on October 20, 2024, and 10.345 billion XRP on November 23, 2024. Those deposit surges preceded increased volatility and upward price movement rather than selling pressure. Comparable transfer patterns are emerging in current market conditions.
Liquidity Metrics Show Familiar Compression
The second indicator involves contracting USD liquidity within XRP’s automated market maker pools. Leading up to the 2024 breakout, daily USD liquidity compressed to approximately $1.5 million. During February 2026, this metric ranges between $1.9 million and $2.1 million — displaying similar compression after reaching above $6 million in September 2025.

The third indicator tracks declining XRP availability. During November 2024, accessible XRP in AMM pools dropped to 1.5 million before the rally commenced. Current data shows daily XRP liquidity averaging 1.385 million — representing even lower levels than the pre-rally period.
Xaif suggests these three concurrent indicators could establish conditions for a move toward $10, representing a 619% increase from present levels. He recommends traders verify with derivatives metrics and funding rates before taking positions.
Institutional Flows Meet Macroeconomic Resistance
Regarding institutional participation, XRP-spot ETFs attracted $3.04 million in net capital on February 24, elevating total cumulative inflows to $1.23 billion since these products launched in November. The ETFs have experienced only five days showing net outflows during this period.
United States consumer confidence registered at 91 for February, surpassing the anticipated reading of 87, which diminished market expectations for a June Federal Reserve rate reduction. The CME FedWatch Tool reflected these changing odds, declining from 54.3% to 49.6% on February 24.
XRP settled at $1.3489 on February 24 before advancing 3.66% to $1.3983 during February 25 morning trading. Primary resistance levels are positioned at $1.50, $2.00, and $2.50, while support zones exist at $1.00 and $0.7773.