 Price Analysis: RWA Assets Surge to $2B While ETF Inflows Cross $1B Milestone")
Key Takeaways
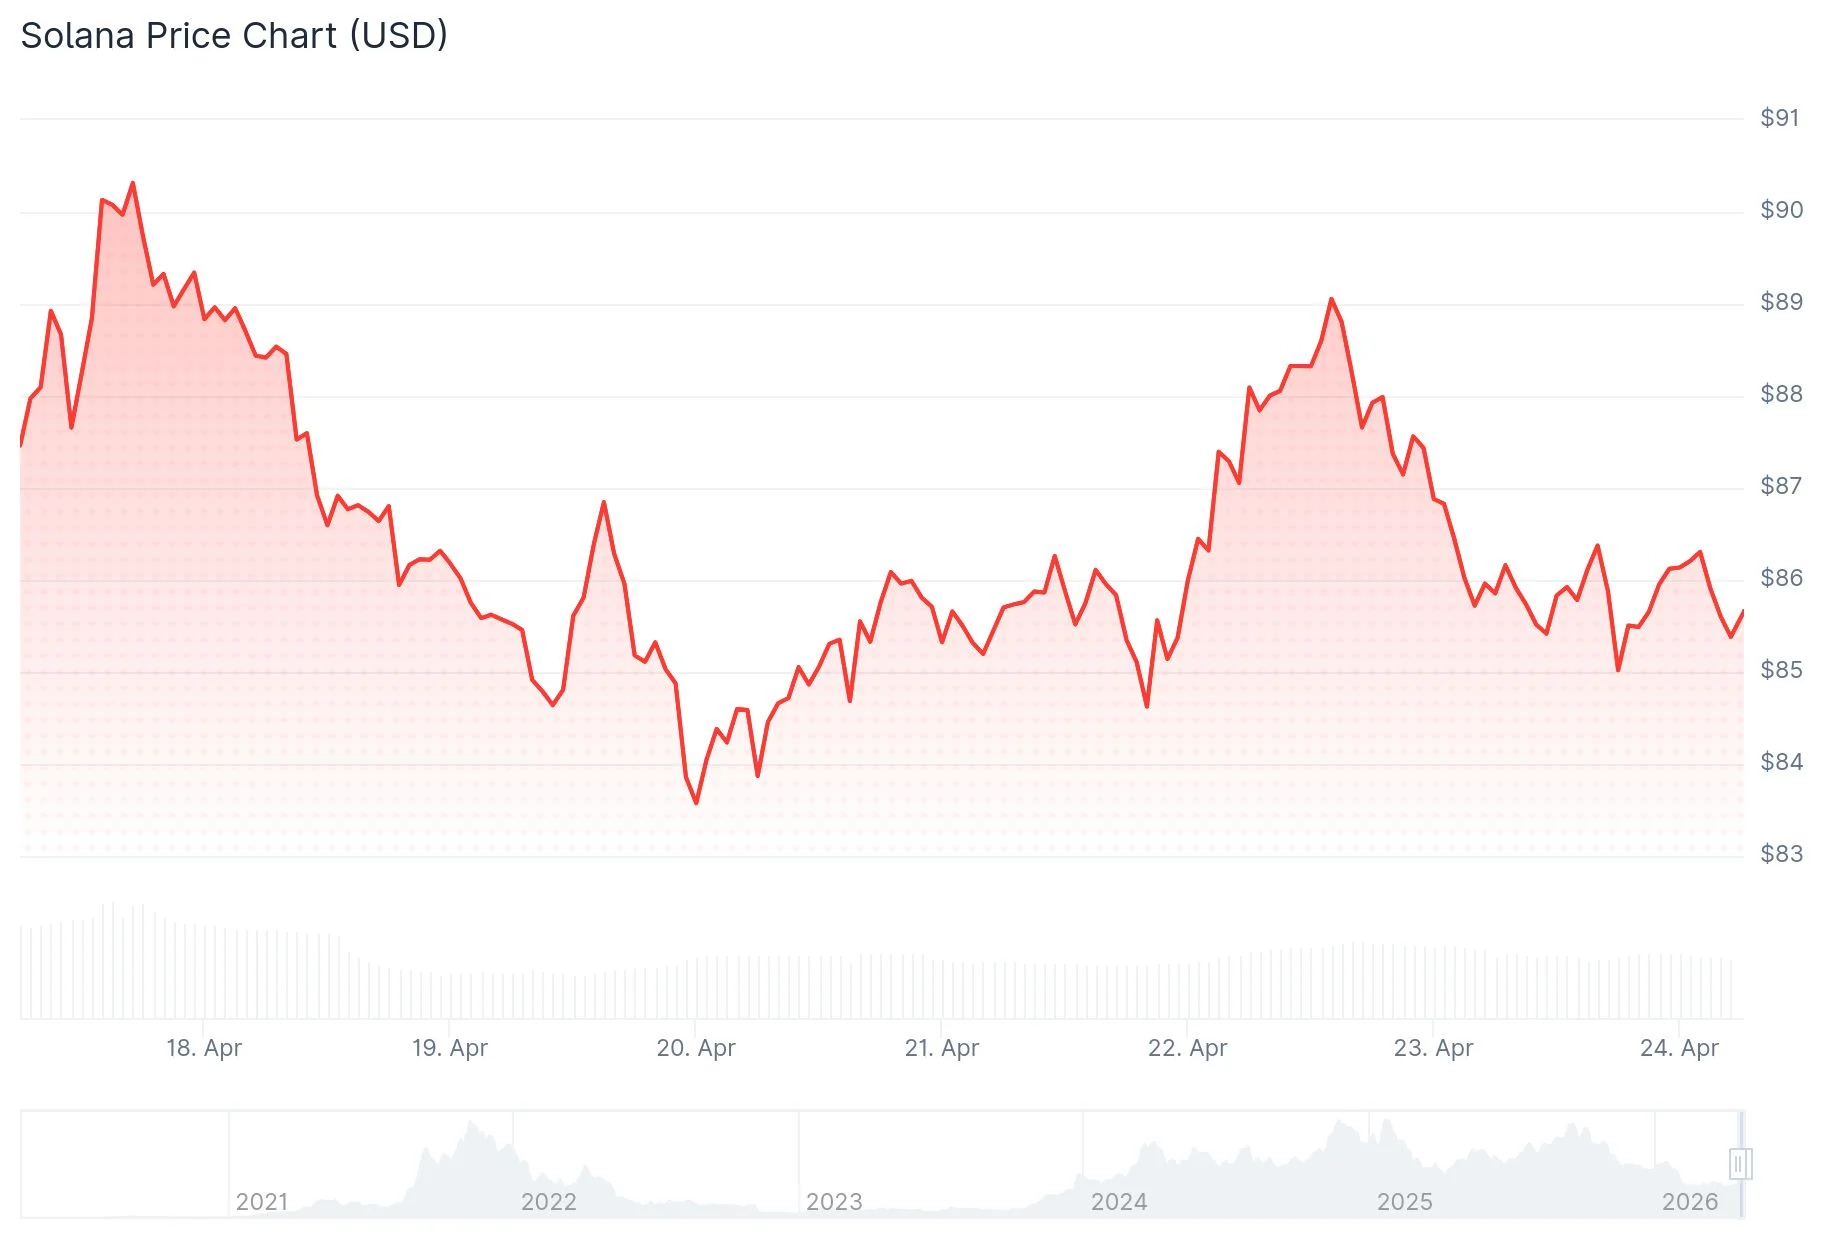
- Solana maintains position at $85.95, supported by the 20-day EMA at $85.31, while facing overhead pressure from the 50-day EMA positioned at $87.08.
- The daily timeframe reveals a breakout above a multi-month descending trendline, with price currently retesting the breakout zone.
- Weekly timeframe analysis identifies $120–$125 as the primary upside target should buyers overcome the current downtrend resistance.
- Real-world asset tokenization on Solana expanded from $170 million to $2 billion over twelve months, supported by 80–100 million active wallets and $17 billion in stablecoin liquidity.
- Solana spot ETF cumulative inflows surpassed the $1 billion threshold, while net assets total $887.92 million.
Solana currently trades at $85.95 as of April 23, reflecting a 1.10% decline over the past 24 hours. Price action has maintained stability above the 20-day EMA located at $85.31, which has provided consistent support throughout the previous week.
The 50-day EMA positioned at $87.08 continues to serve as the primary resistance barrier. Since March, all daily closing prices have encountered rejection at this threshold or below it. The upper Bollinger Band extends to $89.43, while the 100-day EMA tracks further above at $96.63.
Should support fail, a daily close beneath the 20-day EMA would activate the middle Bollinger Band at $84.63 as the subsequent support target. Further downside would engage the lower Bollinger Band at $79.84, with the February low anchored near $67 representing a deeper support foundation.
The daily timeframe displays a breakout above a descending trendline that constrained price action throughout late 2025 and into early 2026. Technical analysis shared by CryptoCurb on X illustrates the breakout materializing after multiple rejection attempts, including episodes during the Binance flash crash and Iran conflict escalation.
Price currently hovers near the breakout region, maintaining position above the previously restrictive trendline. This represents a structural evolution in market behavior. The technical pattern gains credibility when buyers defend this zone and transform the broken trendline into reliable support.
Institutional Capital Accelerates
Nick Ducoff, a Solana ecosystem executive, highlighted that real-world asset tokenization on the network expanded from $170 million to $2 billion across just twelve months—representing approximately a 12-fold increase. Institutional participants cite three primary drivers: consistent network performance, access to 80–100 million active wallets for distribution channels, and $17 billion in stablecoins already deployed on-chain.
Solana spot ETF cumulative inflows have surpassed $1 billion for the first time. Total net assets currently measure $887.92 million, equivalent to 1.77% of Solana’s market capitalization. Weekly ETF inflows registered $35.17 million last week. While April 22 showed zero daily inflow activity, the three preceding trading days accumulated $31.32 million in combined inflows.
Weekly Timeframe Targets $120–$125 Region
Analysis from Rendoshi AI on X examining the weekly chart shows Solana testing a descending trendline after defending support near the $75–$80 range. The RSI indicator has rebounded from proximity to oversold territory, suggesting momentum improvement, though this alone lacks confirmation power for a definitive breakout.

A sustained break and hold above the weekly downtrend line would activate the $120–$125 zone as the subsequent major resistance target. Failure to maintain elevation would confine SOL to range-bound behavior above the $75–$80 support foundation without establishing a clear recovery trajectory.
The 2-hour timeframe shows Solana progressing within an ascending channel structure that originated from the April 2 low near $78. The RSI indicator generated a fresh bullish signal at the recent low near $83—mirroring the same pattern that preceded earlier bounce sequences. The MACD indicator remains negative at -0.25, indicating momentum has yet to validate the signal.
The ascending channel’s lower boundary on the 2-hour chart at $83–$84 coincides with the daily 20-day EMA, establishing this zone as the critical support area requiring attention heading into April 24.