 Surges Past $97 as Traders Eye Critical $100 Threshold")
Key Highlights
- SOL recorded a 7% increase within 24 hours, peaking at $97.67 while the wider cryptocurrency market gained approximately 3.6%.
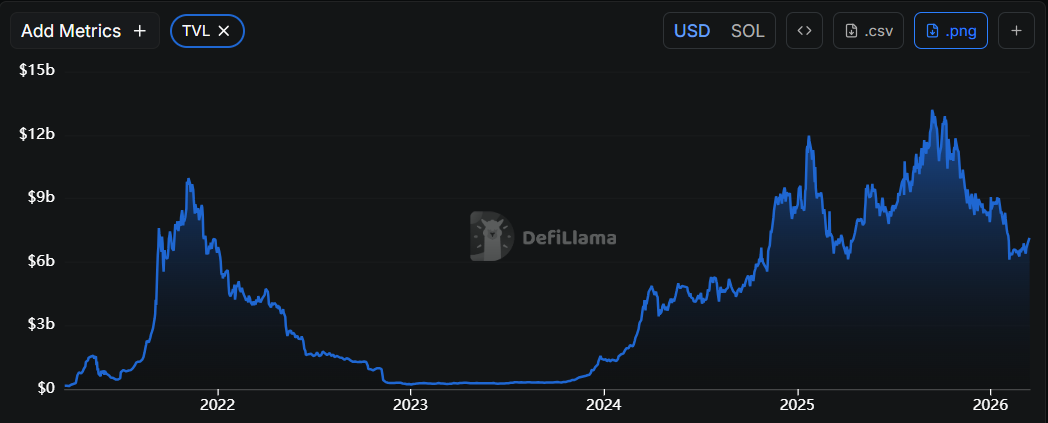
- The Solana network’s total value locked expanded by 25% throughout the past month, reflecting renewed participant interest.
- SOL maintains trading activity above $92 and its 100-hour simple moving average, with bullish technical formation establishing support at $94.
- Critical resistance zones are positioned at $98 and $100, while support levels stand at $92 and $88 during potential retracements.
- The token has appreciated more than 40% from its February bottom, accompanied by RSI climbing toward 60 after recovering from oversold territory.
Solana has delivered impressive 24-hour performance, surging over 7% to reach a peak of $97.67 before experiencing minor consolidation around the $95 zone. This upward movement coincides with recovery across the wider cryptocurrency market, which registered approximately 3.6% gains during the identical timeframe.

Current trading data shows SOL maintaining positions above $92 and the 100-hour simple moving average. Technical analysis reveals a bullish trend line establishing support at $94 on the hourly timeframe, according to Kraken exchange data.
Critical Resistance Zones Ahead
The digital asset currently encounters resistance around $95, with subsequent significant levels positioned at $98. The $100 threshold represents the primary challenge ahead. Successfully breaking above $100 could unlock pathways toward $105 and possibly $112.
Regarding downside scenarios, should SOL lose the $92 level, the following support zone appears at $88. Breaking beneath $88 could introduce $82 as the next target area.
The current uptrend correlates with broader market recovery, though Solana has delivered superior performance compared to most competing top-10 cryptocurrencies during this period.
On-Chain Metrics Reinforce Upward Trajectory
The total value locked within Solana’s ecosystem expanded by 25% throughout the previous month. TVL quantifies liquidity residing within a blockchain infrastructure, and expansion of this magnitude indicates strengthening platform engagement.
Development initiatives and decentralized application deployments across the network have maintained consistent momentum. These blockchain fundamentals have contributed to sustaining current price action.
Solana has appreciated more than 40% since establishing its February low point. The Relative Strength Index has advanced back toward 60 following its rebound from oversold conditions earlier this year.
Recent weeks have seen the price oscillating between $80 support and $95 resistance, creating a consolidation structure that market participants frequently monitor for potential breakout opportunities.
The 200-day moving average continues to position above current price levels, suggesting the extended-term trend has yet to achieve full reversal.
SOL presently trades around $94.62, carrying a market capitalization near $54 billion with a 52-week trading range spanning $70.61 to $252.78.